What Are Developer Tools? Browser DevTools vs Online Tools
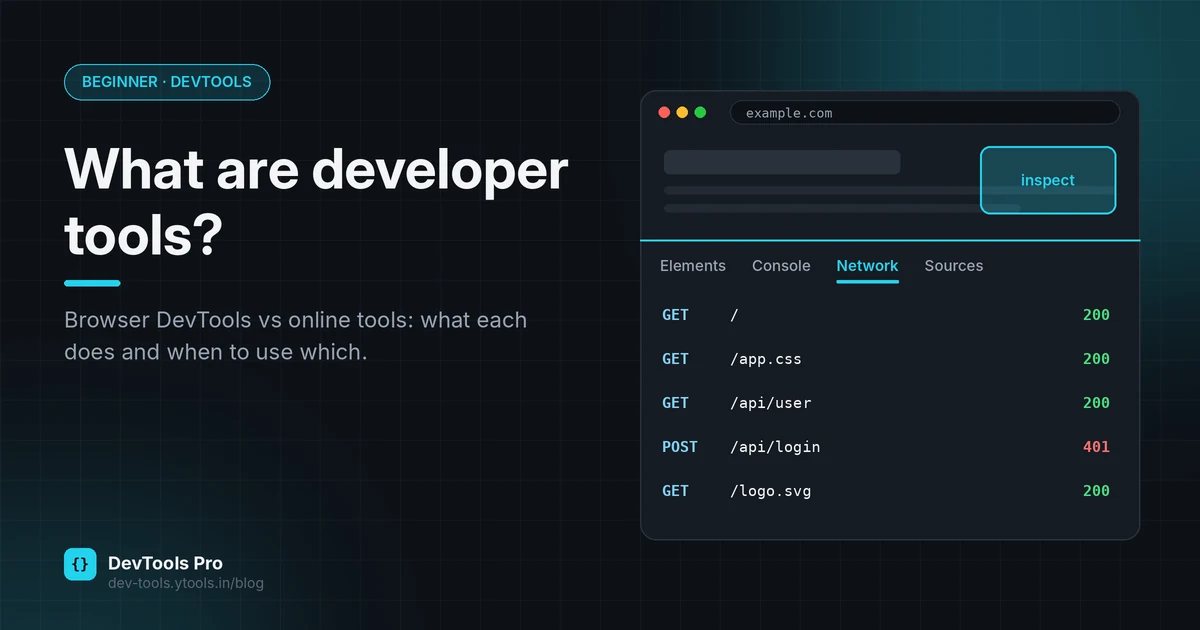
Search for "developer tools" and you'll find two kinds of answer. Some explain the panel that opens when you press F12 in your browser. Others list websites that format JSON or generate passwords. Both are right: the phrase means two different things.
This guide explains both meanings, shows how to open DevTools in every major browser, and walks through a real debugging session that uses the two together.
Quick answer: Browser developer tools (DevTools) are built into Chrome, Edge, Firefox and Safari and let you inspect and debug the page you're viewing: its HTML, CSS, JavaScript, network requests and performance. Online developer tools are web pages that transform data you give them, such as formatting JSON, encoding Base64 or generating a robots.txt file.
In this guide
- Two meanings of "developer tools"
- Browser DevTools, panel by panel
- How to open DevTools
- Online developer tools
- Using both: a debugging workflow
- Common mistakes
- FAQ
Two meanings of "developer tools"
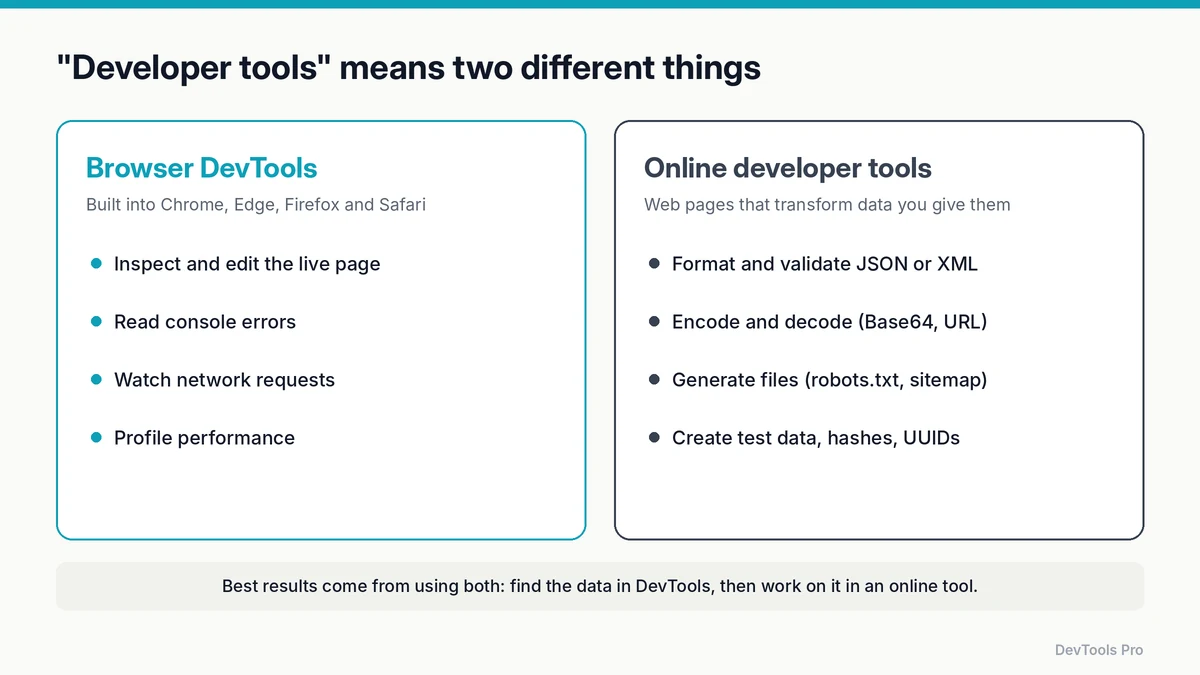
| Browser DevTools | Online developer tools | |
|---|---|---|
| Where they live | Inside your browser | On a website |
| What they work on | The page currently open | Data you paste or upload |
| Typical jobs | Inspect elements, read console errors, watch requests, profile speed | Format JSON, encode/decode, generate files and test data |
| Install | Nothing, they ship with the browser | Nothing, open the page |
| Best for | Finding out what is happening on a page | Doing something with the data you found |
Browser DevTools, panel by panel
MDN describes browser developer tools as a suite that every modern browser includes, covering everything from inspecting loaded HTML, CSS and JavaScript to showing which assets a page requested and how long they took. Panel names differ slightly between browsers, but the core set is the same.
Elements (Inspector in Firefox)
Shows the live DOM, the page's structure after JavaScript has run, plus the CSS applied to each element. You can edit both and see the result instantly. Use it to answer "why is this button blue?" or "where does this margin come from?"
Console
Lists JavaScript errors and warnings, and lets you run JavaScript against the current page. The first place to look when something silently doesn't work.
Network
Records every request the page makes: HTML, scripts, images, API calls. For each one you can see the status code, headers, timing and the response body. This is where you find the JSON your front end received, and it's also how you can check whether an online tool sends your data anywhere (see the 60-second check).
Performance
Records what the browser does while the page loads or responds to input: scripting, rendering, painting. Use it when a page feels slow and you need to know why.
Application (Storage in Firefox)
Shows cookies, local storage, session storage, IndexedDB and service workers. Useful for debugging login state and caching.
Lighthouse
Chrome and Edge include Lighthouse, which audits a page for performance, accessibility, SEO and best practices. If you've wondered why its score changes from run to run, read how the Lighthouse performance score is calculated.
How to open DevTools in Chrome, Edge, Firefox and Safari
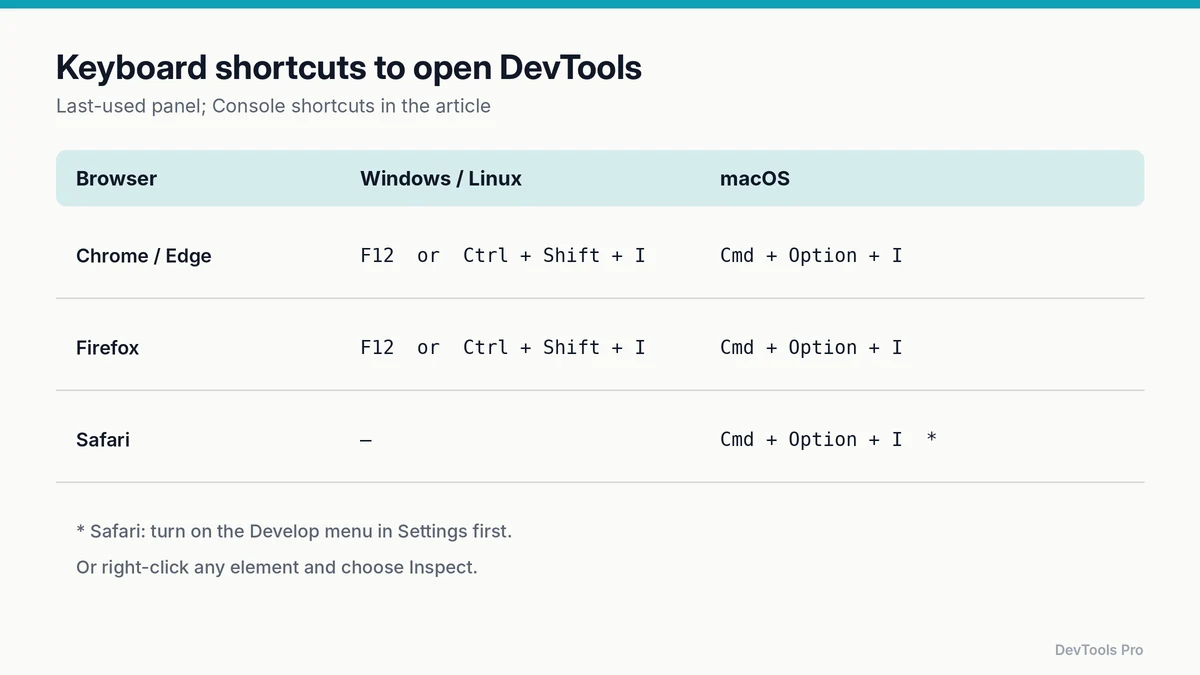
| Browser | Windows / Linux | macOS |
|---|---|---|
| Chrome / Edge | F12 or Ctrl + Shift + I | Cmd + Option + I |
| Firefox | F12 or Ctrl + Shift + I | Cmd + Option + I |
| Safari | Not applicable | Cmd + Option + I (after enabling developer features) |
Chrome's documentation lists more targeted shortcuts too: Ctrl + Shift + J (Cmd + Option + J on Mac) opens straight to the Console, and Ctrl + Shift + C (Cmd + Option + C) opens the Elements panel in inspect mode (Chrome for Developers).
Three other ways that work everywhere:
- Right-click → Inspect on any element. DevTools opens with that element selected.
- The browser menu. In Chrome: More tools → Developer tools. In Firefox: Menu → More tools → Web Developer Tools.
- Safari needs one setting first: open Safari's Settings, go to Advanced, and turn on the option to show features for web developers. The Develop menu then appears in the menu bar.
Online developer tools: what they add
DevTools is excellent at showing you data, and limited at working with it. Online tools fill that gap:
- Readability: a minified 40 KB API response is one line in the Network panel. An online JSON formatter indents it and flags syntax errors.
- Decoding: an
Authorization: Bearer eyJ…header is opaque until a JWT decoder splits it into readable header and claims. - Generating: DevTools can't write you a robots.txt, sitemap or
.htaccessfile. Generators can. - Environment checks: a browser information tool shows your user agent, screen size and enabled features, which helps when reproducing a bug report.
For a full map of what's available, see developer utilities, sorted by job, or browse our online developer tools.
Using both: a real debugging workflow
A common scenario: a profile page shows "Unknown user" for some people. Here's how the two kinds of tool combine.
textPage shows "Unknown user"
   ↓
DevTools → Network → filter "Fetch/XHR" → find /api/user
   ↓  status 200, response is one long line of JSON
Copy the response → JSON formatter
   ↓  formatted: "name" is missing; the field is now "display_name"
Copy the Authorization header → JWT decoder
   ↓  claims show the token was issued for the right user
Conclusion: the API renamed a field; the front end still reads "name"
Neither tool alone gets you there quickly. DevTools finds the evidence; the online tools make it readable.
Common mistakes
Thinking DevTools edits are saved. Changes you make in the Elements or Styles panel affect only your copy of the page and disappear on reload. To keep a fix, copy it into your source files.
Debugging with extensions running. Browser extensions inject scripts and styles that can mask or cause bugs. Reproduce issues in a private window or a clean profile.
Ignoring the "Preserve log" option. If a page redirects, the Network log clears. Turn on Preserve log to keep requests across navigations.
Pasting live tokens into online tools. Decode sample or expired tokens where possible, and never paste production secrets.
Frequently asked questions
How do I open dev tools on a Mac?
Press Cmd + Option + I in Chrome, Edge or Firefox. In Safari, first enable developer features under Safari → Settings → Advanced, then use the same shortcut or the Develop menu.
Are browser developer tools free?
Yes. They ship with every major desktop browser at no cost and need no installation.
Can DevTools change a live website?
No. Edits only affect the copy of the page in your browser and are lost when you reload. Other visitors never see them.
Why is developer tools disabled on my work computer?
Organisations can turn DevTools off through browser management policies. If the menu item is greyed out or the shortcut does nothing, ask your IT administrator.
What's the difference between DevTools and an IDE?
An IDE is where you write and manage source code. DevTools inspects the running result in the browser. Most web developers use both side by side.
How do I open DevTools on a phone?
Mobile browsers don't include a full DevTools panel. Instead, connect the phone to a computer and use remote debugging: Chrome on desktop can inspect Android Chrome, and Safari on a Mac can inspect iOS Safari.
Conclusion
"Developer tools" covers two complementary things. Browser DevTools tells you what a page is actually doing; online developer tools help you read, convert and generate the data involved. Learn the four core DevTools panels (Elements, Console, Network, Performance), keep a handful of online utilities bookmarked, and most front-end bugs become a short investigation instead of a guessing game.
Explore our free online developer tools →
Related tools
JSON formatter · JWT decoder · Browser information
Related articles
- Developer utilities: which free tools you need for each task
- How the Lighthouse performance score is calculated
- Web developer tools checklist: 12 free pre-launch checks
Sources
- MDN — What are browser developer tools?: definition and per-browser opening methods.
- Chrome for Developers — Open Chrome DevTools: official keyboard shortcuts.
- Chrome for Developers — Chrome DevTools: panel overview.
- Firefox Source Docs — Firefox DevTools User Docs: Firefox panel names and features.
Related Posts
How to Compress Images for the Web: JPEG vs WebP vs AVIF
Choose the right image format, compress without visible quality loss, and serve WebP and AVIF safely with fallbacks. Includes a format decision table.
Read More
How to Create an HTML Table: Code, CSS and Accessibility
Build an HTML table from scratch: the right tags, merged cells, responsive CSS and accessible headers, plus how to turn spreadsheet data into HTML.
Read More
How to Create a robots.txt File: Rules, Examples, Mistakes
Create a correct robots.txt in minutes: syntax, copy-paste examples for common setups, how to test it, and the mistakes that accidentally block Google.
Read More