How the Lighthouse Performance Score Is Calculated
You run Lighthouse and get 68. You change nothing, run it again and get 74. Your colleague runs it and gets 59. The score is useful, but only once you know what it's made of and why it moves.
This guide breaks the Lighthouse performance score into its five metrics, shows the exact weights, works through a calculation you can reproduce, and explains which fixes move the number most.
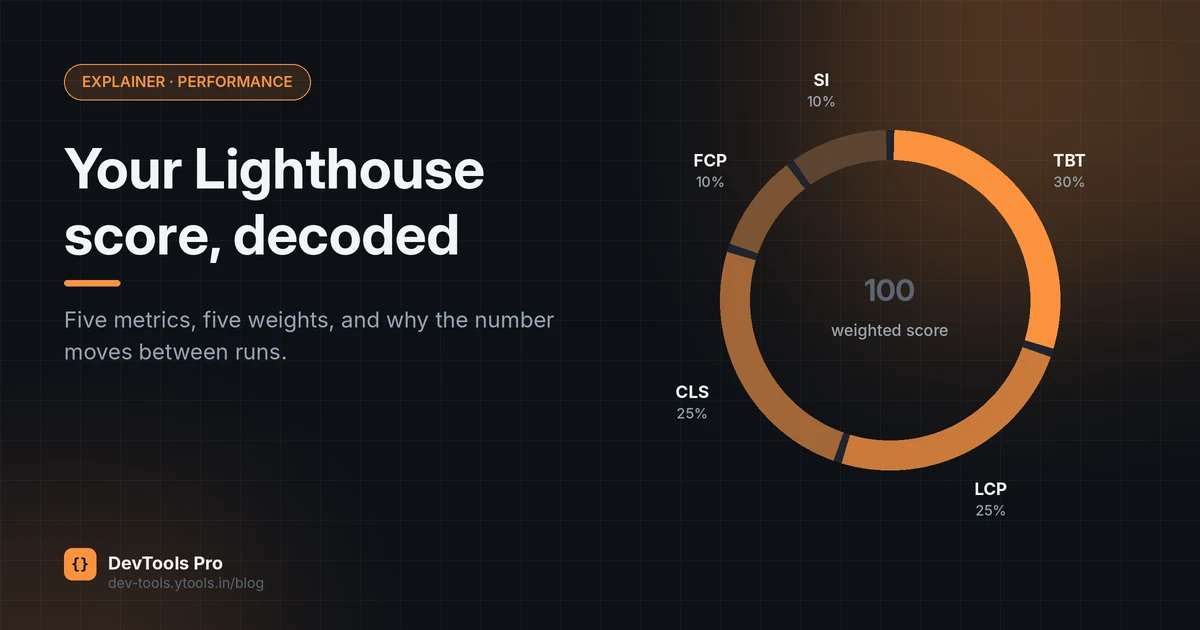
Quick answer: the Lighthouse performance score is a weighted average of five metric scores. In Lighthouse 10 and later the weights are Total Blocking Time 30%, Largest Contentful Paint 25%, Cumulative Layout Shift 25%, First Contentful Paint 10% and Speed Index 10% (Chrome for Developers). Each raw metric is first converted into a 0–100 metric score, then the weighted scores are added up.
In this guide
- The five metrics and their weights
- From raw metric to metric score
- A worked example
- Score bands
- Lab score vs Core Web Vitals
- Why the score changes between runs
- Which fixes move the score most
- FAQ
The five metrics and their weights
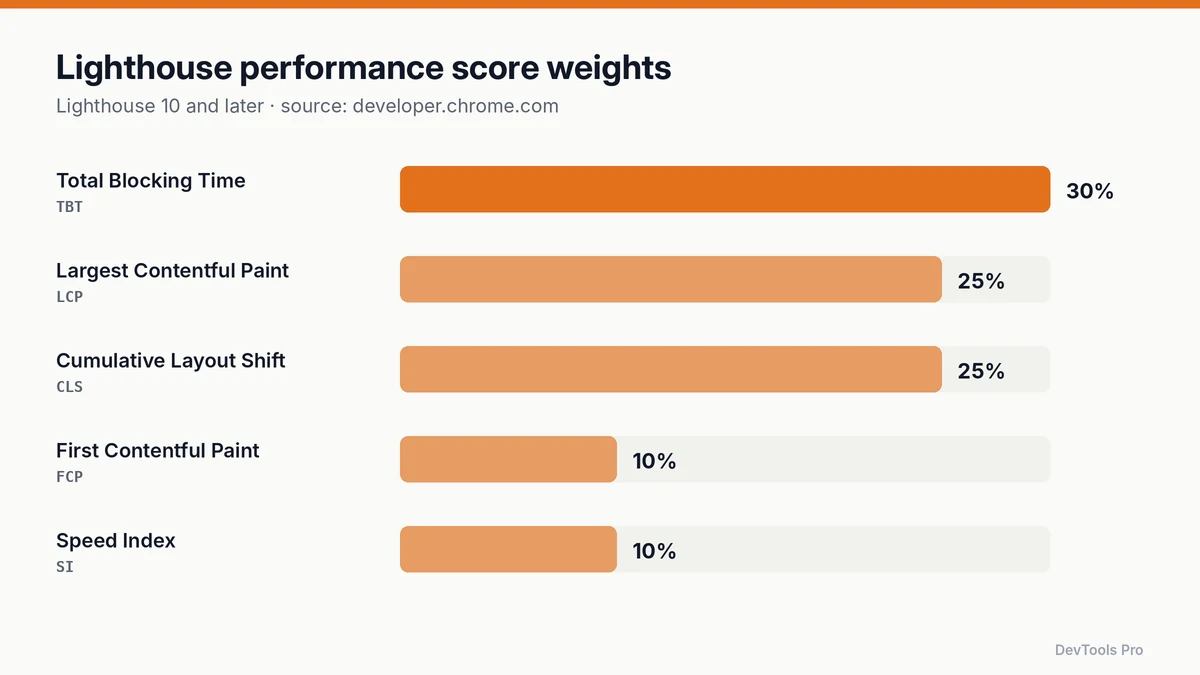
| Metric | What it measures | Weight |
|---|---|---|
| Total Blocking Time (TBT) | How long the main thread was blocked by long tasks between first paint and interactivity, i.e. time the page couldn't respond to input | 30% |
| Largest Contentful Paint (LCP) | When the largest image or text block in the viewport rendered | 25% |
| Cumulative Layout Shift (CLS) | How much visible content moved unexpectedly while loading | 25% |
| First Contentful Paint (FCP) | When the first text or image appeared | 10% |
| Speed Index (SI) | How quickly the visible page filled in overall | 10% |
Weights come from Google's Lighthouse performance scoring documentation. They have changed between major Lighthouse versions, so check the version shown at the bottom of your report when comparing old and new results.
Notice that 80% of the score comes from three metrics: TBT, LCP and CLS. That's where to start.
From raw metric to metric score
Lighthouse doesn't add up seconds. It first converts each raw value, such as an LCP of 3.1 seconds, into a metric score between 0 and 100 using a scoring curve. Google's documentation explains that these curves are derived from real-world performance data, so a metric score reflects how your value compares with sites in general (Chrome for Developers).
Two consequences:
- Gains flatten at the top. Near the fast end of the curve, a big improvement in milliseconds adds few points. Near the middle, small improvements add many.
- Mobile and desktop use different curves, because their expectations differ.
You can try the official conversion yourself in Google's Lighthouse scoring calculator. Our Lighthouse score simulator lets you move each metric score and see the weighted result.
A worked example
Here's the weighting step, using hypothetical metric scores for a page.
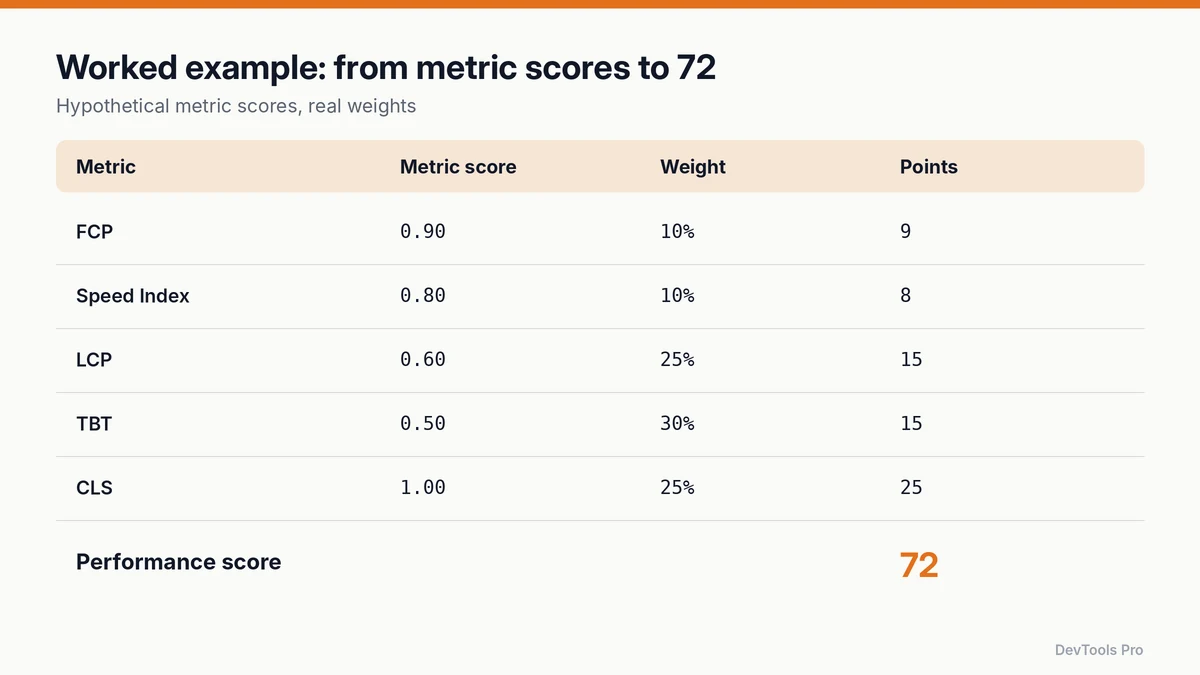
| Metric | Metric score (0–1) | × Weight | = Points |
|---|---|---|---|
| FCP | 0.90 | 10% | 9 |
| Speed Index | 0.80 | 10% | 8 |
| LCP | 0.60 | 25% | 15 |
| TBT | 0.50 | 30% | 15 |
| CLS | 1.00 | 25% | 25 |
| Performance score | 72 |
Now compare two possible fixes:
- Improve FCP from 0.90 to 1.00: +1 point (0.10 × 10).
- Improve TBT from 0.50 to 0.80: +9 points (0.30 × 30).
Same effort on paper, very different result. The weights tell you where your time is worth spending.
What the colours mean
| Score | Label |
|---|---|
| 90–100 | Good (green) |
| 50–89 | Needs improvement (orange) |
| 0–49 | Poor (red) |
These are the bands Lighthouse uses in its report. A green score is a good sign, not a guarantee that real users have a fast experience.
Lab score vs Core Web Vitals
Lighthouse is a lab test: one page load, on one simulated device and connection, at one moment. Core Web Vitals are field data: measurements from real users' visits, judged at the 75th percentile. Google's "good" thresholds are LCP within 2.5 s, INP of 200 ms or less and CLS of 0.1 or less (web.dev).
| Lighthouse (lab) | Core Web Vitals (field) | |
|---|---|---|
| Data source | One controlled test run | Real visits over time |
| Responsiveness metric | TBT (a lab proxy) | INP (measured from real interactions) |
| Best for | Debugging, before and after a change | Knowing what users actually experience |
| Varies because of | Test machine, network, extensions | Your users' devices and networks |
A standard Lighthouse page-load run doesn't measure INP, because INP needs real user interactions. TBT is the closest lab signal: long main-thread tasks during load usually mean slow responses later.
Why your Lighthouse score changes between runs
Google's documentation lists the usual causes of variability: A/B tests or ads serving different content, network routing changes, different test hardware, browser extensions, and antivirus software interfering (Chrome for Developers). It recommends treating performance as a distribution of scores rather than a single number.
How to monitor Lighthouse scores reliably
- Run several times and use the median, not the best or the first result.
- Test in a clean profile or incognito window with extensions off.
- Keep conditions fixed: same device type (mobile or desktop), same URL, same Lighthouse version.
- Automate it. Running Lighthouse in CI on every deploy catches regressions before users do.
- Set a performance budget, limits for page weight, request count or metric values, and fail the build when a change breaks it. The performance budget calculator helps you pick realistic numbers.
- Confirm with field data once you have traffic (for example, the Core Web Vitals report in Search Console).
Which fixes move the score most
Work down the weights.
Total Blocking Time (30%)
- Split long JavaScript tasks; defer anything not needed for the first view.
- Remove or delay third-party scripts (chat widgets, tag managers, A/B tools).
- Ship less JavaScript: audit bundles and remove unused dependencies. Minify your code as a baseline, not a cure.
Largest Contentful Paint (25%)
- Find the LCP element in the report; it's often a hero image.
- Compress images for faster LCP: right size, modern format, never lazy-loaded if it's the LCP image.
- Reduce server response time and render-blocking CSS.
Cumulative Layout Shift (25%)
- Set
widthandheight(oraspect-ratio) on images and embeds. - Reserve space for ads, banners and late-loading components, including loading states (accessible CSS spinners that don't shift layout).
- Avoid inserting content above existing content after load.
FCP and Speed Index (10% each)
Usually improve as a side effect of the LCP work: less render-blocking CSS, faster server response, smaller critical resources.
Common mistakes
- Chasing 100. Past the high 90s, gains are tiny and costly. Fix real user problems first.
- Comparing runs from different machines or Lighthouse versions.
- Testing only desktop. Mobile scoring is stricter and closer to many users' reality.
- Treating the lab score as the ranking signal. Google's page experience guidance is about real-user experience, not a lab number.
- Optimising FCP first because it's easiest, when TBT carries three times the weight.
Frequently asked questions
What is a good Lighthouse performance score?
90–100 is labelled good, 50–89 needs improvement, and 0–49 is poor. Use the score to find weak metrics, then confirm improvements with real-user data.
Why does my Lighthouse score change every time I run it?
Network conditions, test hardware, extensions, antivirus software and changing page content (ads, experiments) all vary between runs. Run several tests and use the median.
Does the Lighthouse score affect Google rankings?
Not directly. Lighthouse is a lab tool. Google's page experience guidance relies on how real users experience your pages, which is what Core Web Vitals field data measures. Improving Lighthouse metrics usually improves field metrics too.
Why are mobile and desktop scores different?
Lighthouse simulates a slower device and network for mobile tests and applies different scoring curves, so the same page normally scores lower on mobile.
How is the Lighthouse score calculated?
Each of five metrics is converted to a 0–100 score with a scoring curve, then combined with weights: TBT 30%, LCP 25%, CLS 25%, FCP 10%, Speed Index 10% (Lighthouse 10+).
How do I monitor Lighthouse scores over time?
Run Lighthouse automatically in CI or on a schedule, under fixed settings, record the median of several runs, and set performance budgets that fail a build when exceeded.
Conclusion
The Lighthouse performance score is arithmetic, not magic: five metric scores, five weights, one sum. Start with the 30% and 25% metrics, measure with medians rather than single runs, and use real-user Core Web Vitals to confirm that a better number means a faster site.
See how each metric changes your score in the Lighthouse score simulator →
Related tools
Lighthouse score simulator · Performance budget calculator · Image compressor · Code minifier
Related articles
- How to compress images for the web
- How to make an accessible CSS loading spinner
- What are developer tools? Browser DevTools vs online tools
Sources
- Chrome for Developers — Lighthouse performance scoring: metric weights, scoring curves and variability.
- Lighthouse Scoring Calculator: reproduce scores from metric values.
- web.dev — Web Vitals: Core Web Vitals thresholds.
- Google Search Central — Understanding page experience: how Google Search treats page experience.
Related Posts
How to Compress Images for the Web: JPEG vs WebP vs AVIF
Choose the right image format, compress without visible quality loss, and serve WebP and AVIF safely with fallbacks. Includes a format decision table.
Read More
How to Create an HTML Table: Code, CSS and Accessibility
Build an HTML table from scratch: the right tags, merged cells, responsive CSS and accessible headers, plus how to turn spreadsheet data into HTML.
Read More
How to Create a robots.txt File: Rules, Examples, Mistakes
Create a correct robots.txt in minutes: syntax, copy-paste examples for common setups, how to test it, and the mistakes that accidentally block Google.
Read More