What Is Money Analytics? A Simple Personal Finance Guide
Businesses analyze their numbers every month: revenue, costs, margins, trends. Households rarely do, even though the data is already there in every bank statement and UPI history.
Money analytics (or personal finance analytics) means using your own transaction data to understand where your money goes, why it changes, and what to do next. It doesn't require spreadsheets or statistics, just consistent categories and a few simple calculations.
Money analytics vs budgeting
Budgeting is a plan: how much you intend to spend in each category. Money analytics is the feedback: what actually happened, and what it means. They work together. A budget without analysis is a guess; analysis without a budget has nothing to compare against.
The four levels of money analytics
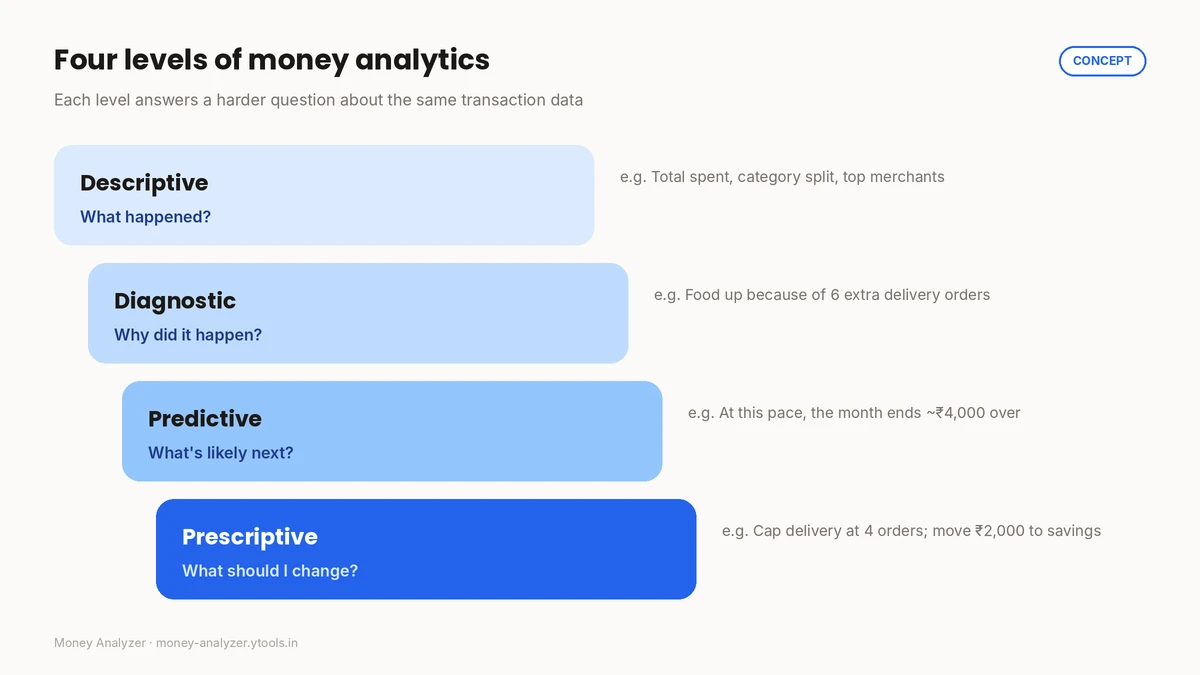
Each level answers a harder question using the same data.
1. Descriptive: what happened?
Total spending, spending by category, top merchants, money left over. This is where everyone should start; see How to Analyze Your Monthly Expenses.
2. Diagnostic: why did it happen?
Drilling into a change. Food spending is up. Is that groceries or delivery? More orders or bigger orders? Diagnosis usually means splitting a category or looking at frequency and timing.
3. Predictive: what's likely next?
Simple projections from your own data. I've spent ₹26,000 by the 15th of a 30-day month; at the same pace, I'll reach about ₹52,000. (₹26,000 ÷ 15 days × 30 days = ₹52,000.) Projections assume the rest of the month looks like the first half, which is rarely exact, so treat them as an early warning, not a forecast.
4. Prescriptive: what should I change?
Turning findings into one or two specific actions: cap delivery at four orders a week; move ₹2,000 to savings on payday. This is where analysis becomes useful.
Example: a simple money dashboard
Example. The numbers below are illustrative, not real-world statistics.
You don't need dozens of charts. Five numbers and one breakdown answer most "how did this month go?" questions:
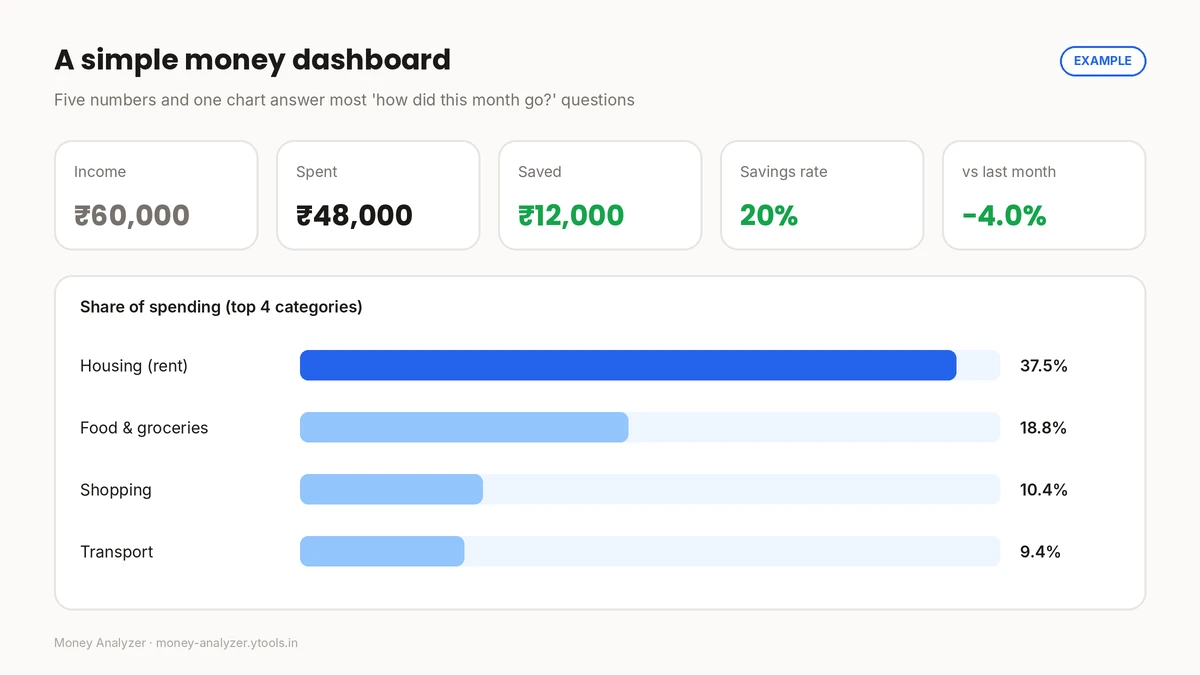
| Metric | Value | How it's calculated |
|---|---|---|
| Income | ₹60,000 | Take-home pay |
| Spent | ₹48,000 | Sum of all expense categories |
| Saved | ₹12,000 | ₹60,000 − ₹48,000 |
| Savings rate | 20% | ₹12,000 ÷ ₹60,000 × 100 |
| vs last month | −4.0% | (₹48,000 − ₹50,000) ÷ ₹50,000 × 100 |
| Largest category | Housing, 37.5% | ₹18,000 ÷ ₹48,000 × 100 |
Read it top to bottom: income, what went out, what stayed, how that compares with last month, and where the biggest share went. 7 Personal Finance Metrics to Track expands this into a fuller set.
What data you need (and what you don't)
You need: date, amount, a short description, and a category for each transaction. Your monthly income. Ideally, a budget per category.
You don't need: account numbers, card numbers, passwords, OTPs or PINs. No legitimate analysis requires them, and RBI's public awareness material repeatedly warns never to share those credentials. How to Analyze Bank Statement Spending Safely covers this in detail.
Getting started in three steps
- Pick one month and categorize every transaction.
- Build the five-number dashboard above.
- Repeat next month and compare. Two months of data is where analytics starts to show trends; three makes them more reliable. (Month-over-Month Spending Analysis shows how.)
The limits of money analytics
- Garbage in, garbage out. Missing cash or uncategorized transactions skew every number.
- Short histories are noisy. One unusual month (a wedding, a medical bill) can distort trends.
- Analysis informs decisions; it doesn't make them. Decisions about debt, investments or taxes depend on your full situation. For those, consider a qualified, registered professional.
How Money Analyzer can help
Money Analyzer is a free tool for tracking expenses, managing budgets and analyzing spending with charts, essentially the descriptive and diagnostic levels above, done for you once your transactions are entered. Review its privacy policy before entering financial information.
Frequently asked questions
What is money analytics?
Money analytics is the practice of using your own financial data (mainly transactions, income and budgets) to understand your spending, spot changes and decide what to adjust.
Is money analysis the same as financial planning?
No. Money analysis looks at what has happened and what it implies. Financial planning sets long-term goals and strategies, often involving investments, insurance and taxes. Analysis is a useful input to planning.
What are the most important personal finance metrics?
For most people: total spending, savings rate, spending by category, budget variance and month-over-month change. Emergency fund coverage and EMI-to-income are useful additions.
Do I need a spreadsheet for money analytics?
No. A spreadsheet works, and so does a dedicated tool that categorizes and charts your spending for you.
How many months of data do I need?
One month gives a baseline. Two lets you compare. Three or more makes trends more reliable.
Conclusion
Money analytics is simply asking better questions of data you already have: what happened, why, what's likely next, and what to change. Start with one month and five numbers, and build from there.
See your own numbers: analyze your spending with Money Analyzer.
This article is general educational information, not personalised financial advice.
Sources: Reserve Bank of India, Financial Education (FAME) · Consumer Financial Protection Bureau, Your Money, Your Goals toolkit
Related Posts
How to Analyze Bank Statement Spending Safely
Learn to read bank and UPI statements, categorize transactions, and analyze your spending, while keeping OTPs, PINs and account details private.
Read More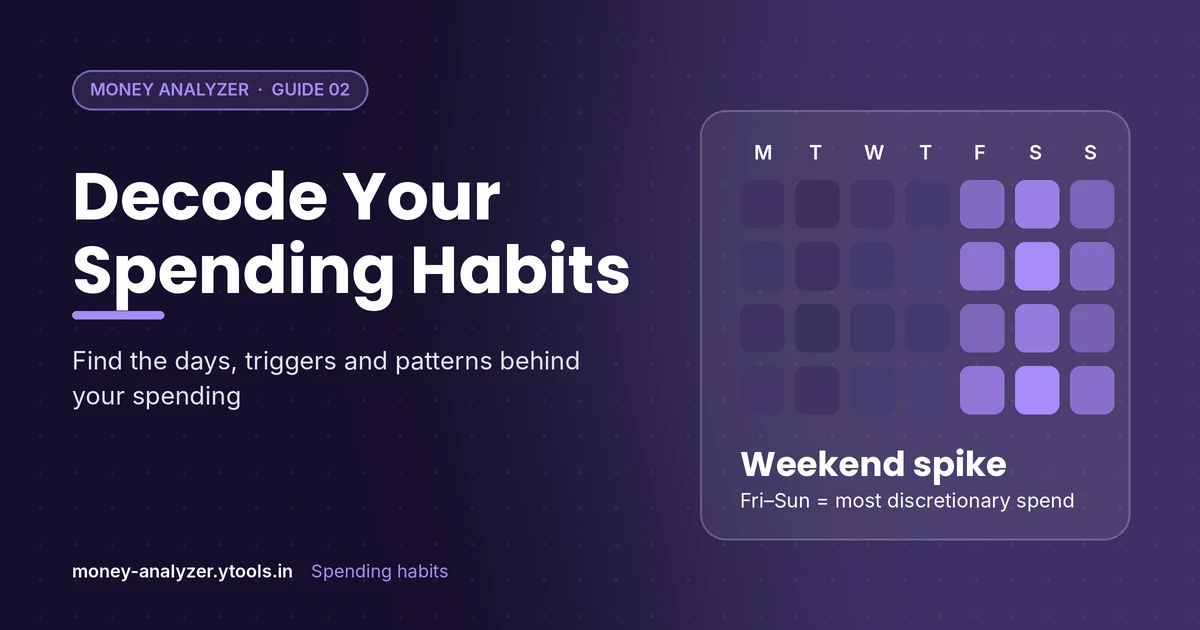
How to Analyze Your Spending Habits: Find Your Patterns
Learn how to analyze your spending habits by looking at frequency, timing and triggers. Includes a worked ₹ example and a simple habit-review method.
Read More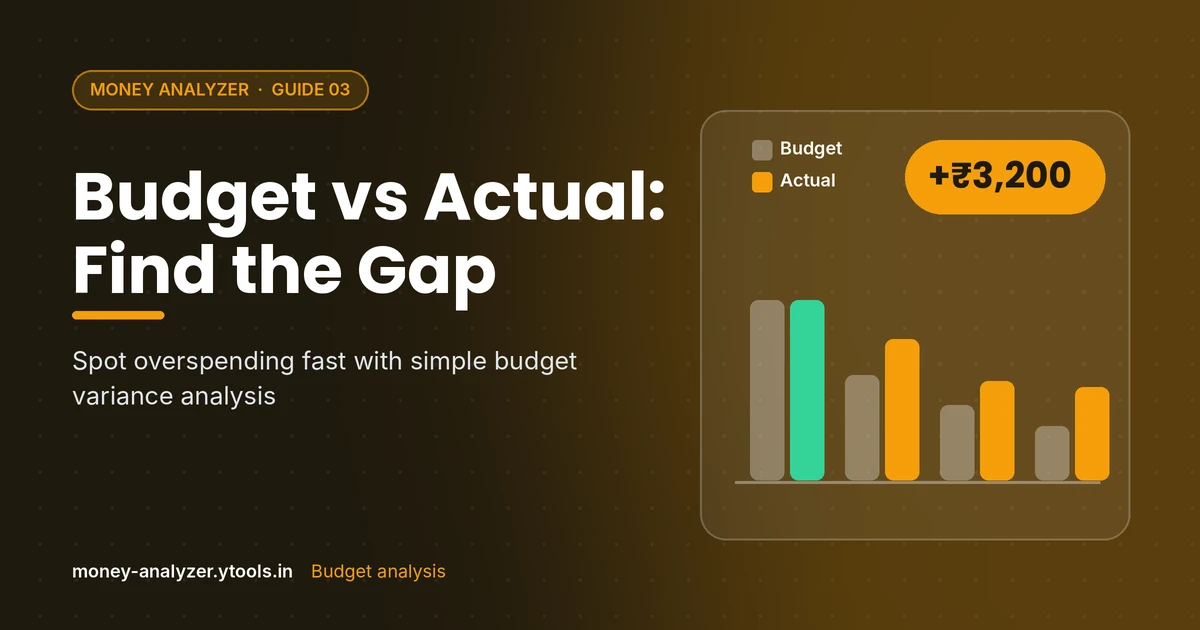
Budget vs Actual Spending: How to Analyze the Gap
Compare your budget with actual spending, calculate variance in ₹ and %, and decide what to change. Includes a worked example with every formula shown.
Read More