Month-over-Month Spending Analysis: Read Your Trend
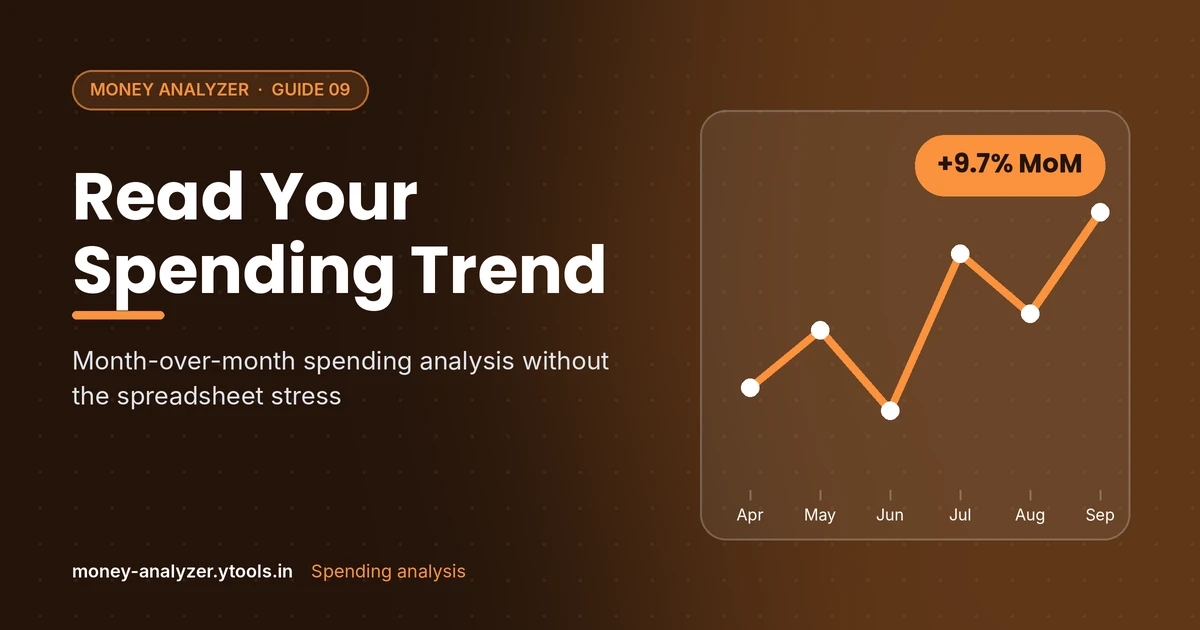
"I spent more this month" is true surprisingly often, and it doesn't always mean anything. Months differ in length, festivals and birthdays fall unevenly, and annual bills land in one month. To know whether your spending is genuinely rising, you need to look at more than two months at once.
This guide shows you how to calculate month-over-month (MoM) change, how to smooth it with a moving average, and how to tell a real trend from a one-off.
Why single months mislead
Any single month can include an unusual expense: a wedding gift, a medical bill, an annual insurance premium, festival shopping. Comparing that month with the one before will show a big jump that says nothing about your habits. Looking at several months, and at categories rather than only totals, separates noise from trend.
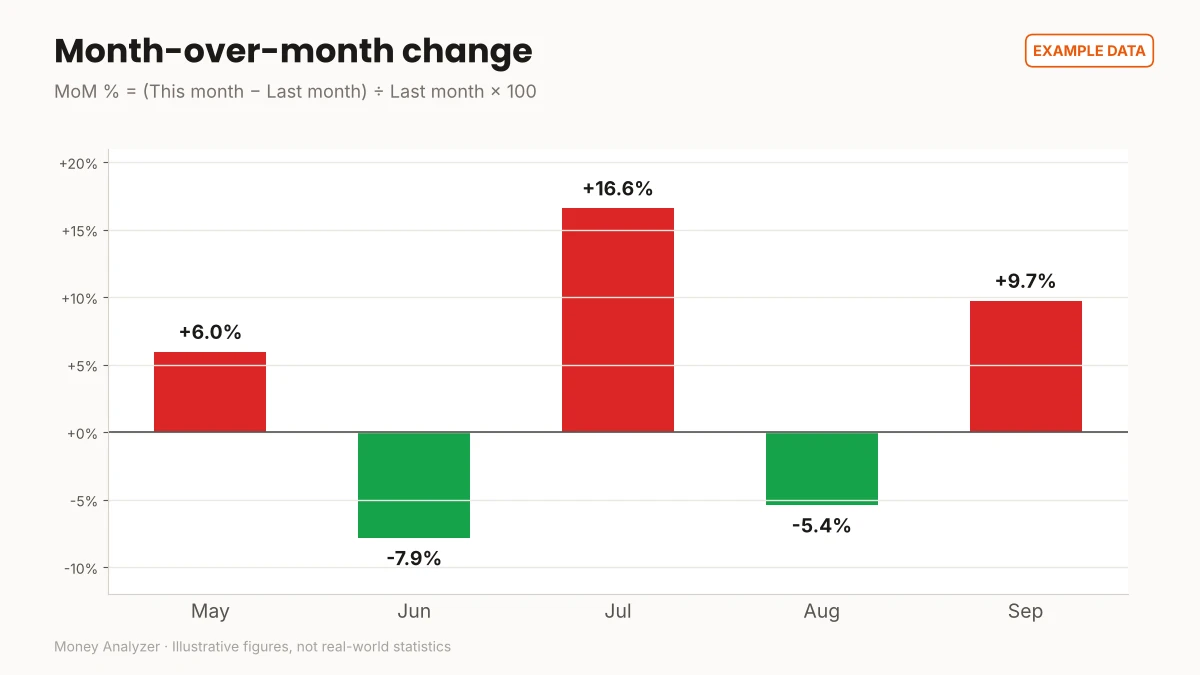
The month-over-month formula
textMoM change (%) = (This month − Last month) ÷ Last month × 100
If you spent ₹45,200 in August and ₹49,600 in September:
text(₹49,600 − ₹45,200) ÷ ₹45,200 × 100 = ₹4,400 ÷ ₹45,200 × 100 = +9.7%
The 3-month moving average
A moving average smooths out single-month spikes:
text3-month moving average = (This month + Last month + Month before) ÷ 3
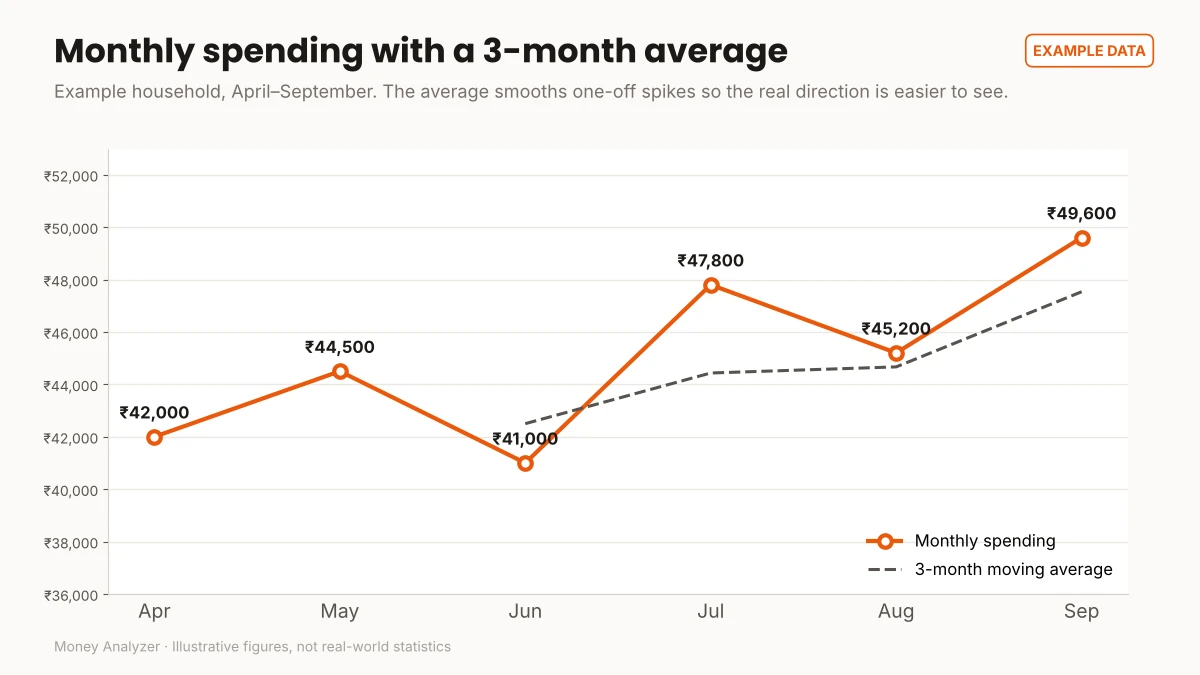
If the moving average rises steadily, spending really is trending up. If monthly figures jump around but the average stays flat, you're mostly seeing noise.
Example: six months of spending
Example. The numbers below are illustrative, not real-world statistics.
| Month | Spending | MoM change | 3-month moving average |
|---|---|---|---|
| April | ₹42,000 | — | — |
| May | ₹44,500 | +6.0% | — |
| June | ₹41,000 | −7.9% | ₹42,500 |
| July | ₹47,800 | +16.6% | ₹44,433 |
| August | ₹45,200 | −5.4% | ₹44,667 |
| September | ₹49,600 | +9.7% | ₹47,533 |
Checking the maths
textMay  MoM = (44,500 − 42,000) ÷ 42,000 × 100 = +5.95% ≈ +6.0%
Jun  MoM = (41,000 − 44,500) ÷ 44,500 × 100 = −7.87% ≈ −7.9%
Jul  MoM = (47,800 − 41,000) ÷ 41,000 × 100 = +16.59% ≈ +16.6%
Aug  MoM = (45,200 − 47,800) ÷ 47,800 × 100 = −5.44% ≈ −5.4%
Sep  MoM = (49,600 − 45,200) ÷ 45,200 × 100 = +9.73% ≈ +9.7%

Jun MA = (42,000 + 44,500 + 41,000) ÷ 3 = ₹42,500
Jul MA = (44,500 + 41,000 + 47,800) ÷ 3 = ₹44,433 (rounded)
Aug MA = (41,000 + 47,800 + 45,200) ÷ 3 = ₹44,667 (rounded)
Sep MA = (47,800 + 45,200 + 49,600) ÷ 3 = ₹47,533 (rounded)

April → September change = (49,600 − 42,000) ÷ 42,000 × 100 = +18.1%
What this shows
- The MoM bars swing between −7.9% and +16.6%. On their own, they look chaotic.
- The moving average tells a clearer story: it rises in every month shown, from ₹42,500 to ₹47,533.
- Over six months, spending rose 18.1%. That's a real trend worth investigating, not one bad month.
The next step is to find which categories drove it.
Reading the trend: three common causes
| Cause | What it looks like | What to do |
|---|---|---|
| One-off expense | One spike, then back to normal; moving average barely moves | Note it; consider a buffer for irregular costs |
| Seasonality | Spikes in the same months each year (festivals, school fees, holidays) | Compare with the same month last year, not just last month |
| Lifestyle creep | Moving average rises steadily, often in discretionary categories | Run a category trend and a spending habits review |
Category-level trends
Total spending can hide opposite movements: transport falling while delivery rises. Run the same MoM and moving-average calculation for your three or four largest variable categories. The category whose moving average rises fastest is usually the cause of the overall trend.
Common mistakes
- Reacting to one month. Use the moving average.
- Comparing festival months with ordinary months. Use year-over-year for seasonal categories.
- Changing categories mid-period. The trend breaks.
- Ignoring income. If income rose too, a higher spend may still mean a stable or higher savings rate. Track savings rate alongside spending.
How Money Analyzer can help
Trends need several months of consistently categorized data. Money Analyzer tracks your expenses and shows your spending in charts, which makes month-to-month changes easier to see. Review the privacy policy before entering financial information.
Frequently asked questions
How do I calculate month-over-month spending change?
MoM % = (This month − Last month) ÷ Last month × 100. A positive number means you spent more than the previous month.
What is a 3-month moving average?
It's the average of the current month and the two before it. It smooths out one-off spikes so you can see the underlying direction.
How many months of data do I need to see a trend?
At least three; six is better. Fewer than three months can't distinguish a trend from a one-off.
Why did my spending jump this month?
Check for one-off expenses, annual bills and seasonal events first. If none explains it, look at category-level changes to find which category grew.
Should I compare with last month or last year?
Both. Last month shows recent change; the same month last year adjusts for seasonal patterns such as festivals or school fees.
Conclusion
Month-over-month change tells you what moved. The moving average tells you whether it matters. Use both, look at categories, and separate one-offs and seasonal months from genuine trends before deciding what to change.
See your trend: track your spending month by month in Money Analyzer. For the full monthly routine, start with How to Analyze Your Monthly Expenses.
This article is general educational information, not personalised financial advice.
Sources: Vikaspedia (Government of India), Household budgeting and cash flow management · Consumer Financial Protection Bureau, Your Money, Your Goals toolkit
Related Posts
How to Analyze Bank Statement Spending Safely
Learn to read bank and UPI statements, categorize transactions, and analyze your spending, while keeping OTPs, PINs and account details private.
Read More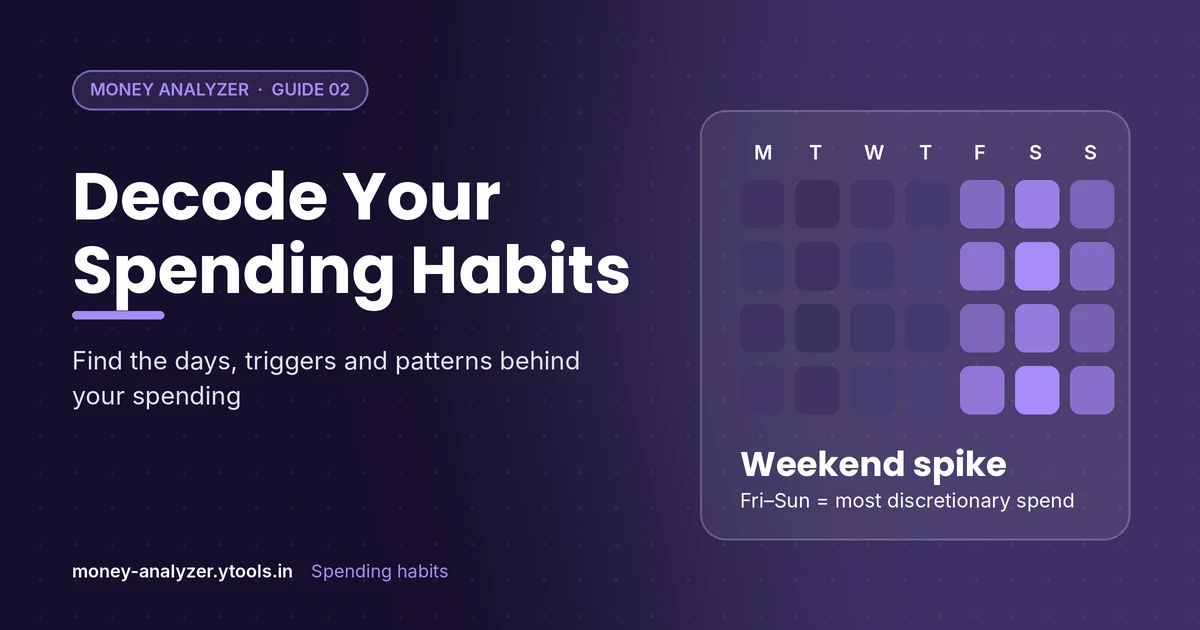
How to Analyze Your Spending Habits: Find Your Patterns
Learn how to analyze your spending habits by looking at frequency, timing and triggers. Includes a worked ₹ example and a simple habit-review method.
Read More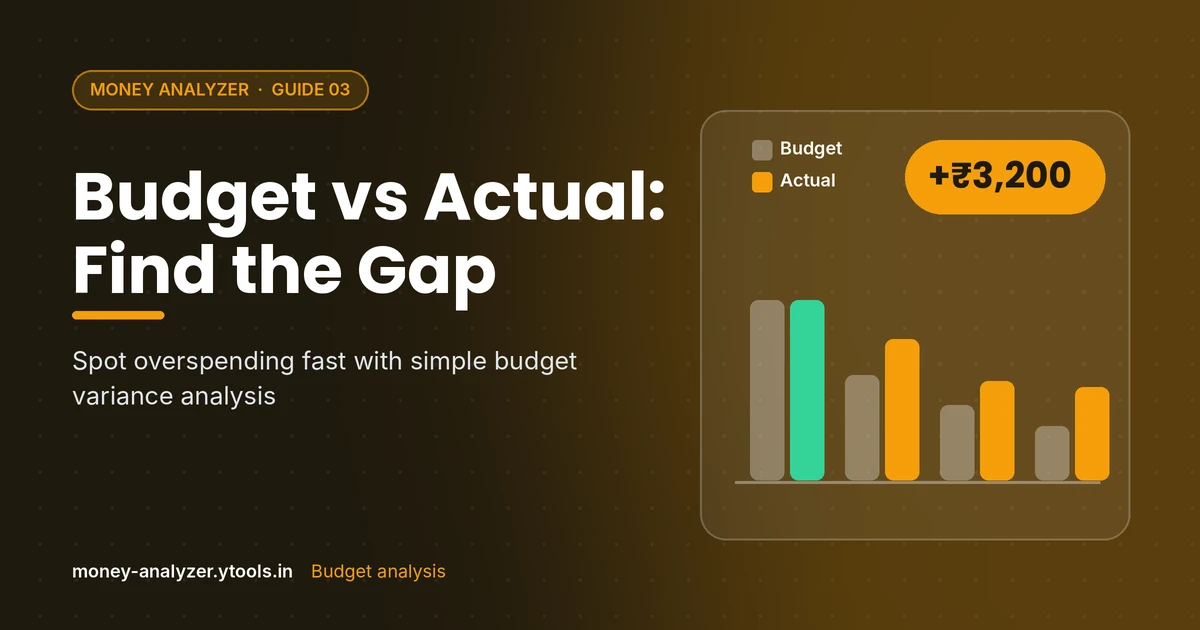
Budget vs Actual Spending: How to Analyze the Gap
Compare your budget with actual spending, calculate variance in ₹ and %, and decide what to change. Includes a worked example with every formula shown.
Read More