How to Analyze Your Spending Habits: Find Your Patterns
A single ₹400 dinner doesn't change your finances. The same dinner every Friday for a year does. That's the difference between a purchase and a habit, and it's why analyzing your spending habits is often more useful than staring at monthly totals.
This guide shows you how to look at your spending through four lenses (frequency, timing, size and trigger), then works through an example where the pattern only appears once you look at days of the week.
Spending habits vs one-off purchases
A habit is spending that repeats with some regularity: daily coffee, weekly delivery orders, a monthly "treat" shopping trip. A one-off is something that doesn't recur on a schedule: a new phone, a wedding gift, a car repair.
Both matter, but habits are where analysis pays off, because a small change repeats every week. One-offs are usually better handled by planning ahead (setting money aside for them) than by habit change.
The four lenses for analyzing spending habits
Start with one complete month of transactions, already categorized. (If you haven't done that yet, How to Analyze Your Monthly Expenses covers it.) Then look at your discretionary categories (eating out, delivery, shopping, entertainment) through each lens.
1. Frequency: how often?
Count transactions per category. Twenty-two delivery orders in a month is about five a week. Seeing the count is often more surprising than seeing the total.
textWeekly frequency = Monthly count ÷ (Days in month ÷ 7)
Example: 22 orders ÷ (30 ÷ 7) = 22 ÷ 4.29 ≈ 5.1 orders per week
2. Timing: when?
Group discretionary spending by day of the week, time of day, or point in the pay cycle. Common patterns include weekend spikes, late-night ordering, and a burst of spending in the first few days after payday.
3. Size: how big is a typical transaction?
textAverage transaction = Category total ÷ Number of transactions
Many small transactions and a few large ones need different responses. Small frequent spends respond to friction (removing saved cards, adding a waiting period). Large infrequent ones respond to planning.
4. Trigger: what came just before?
This one isn't in your bank data, so you'll need to think. For your most frequent discretionary spends, ask what usually happens right before: a long workday, boredom, a sale notification, being with particular friends, payday. Write down the most common trigger for each.
The spending habit loop
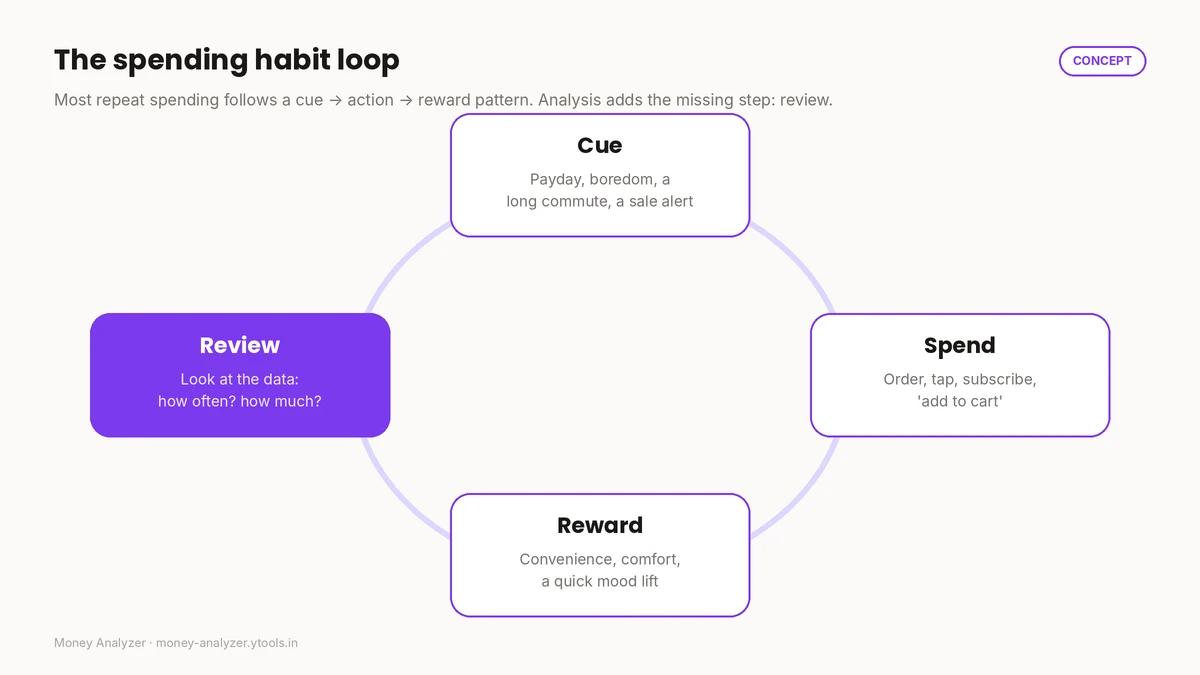
Most repeat spending follows a simple loop: a cue (tired after work) leads to an action (order food) that delivers a reward (comfort and convenience). The loop runs on autopilot because nothing in it asks, "Was that worth it?"
Analysis adds that missing step: review. Looking at the frequency, timing and size of a habit, a month later, is what makes the loop visible. You don't need to remove the reward; you need to decide whether the cost matches the value.
Example: the weekend spike
Example. The numbers below are illustrative, not real-world statistics.
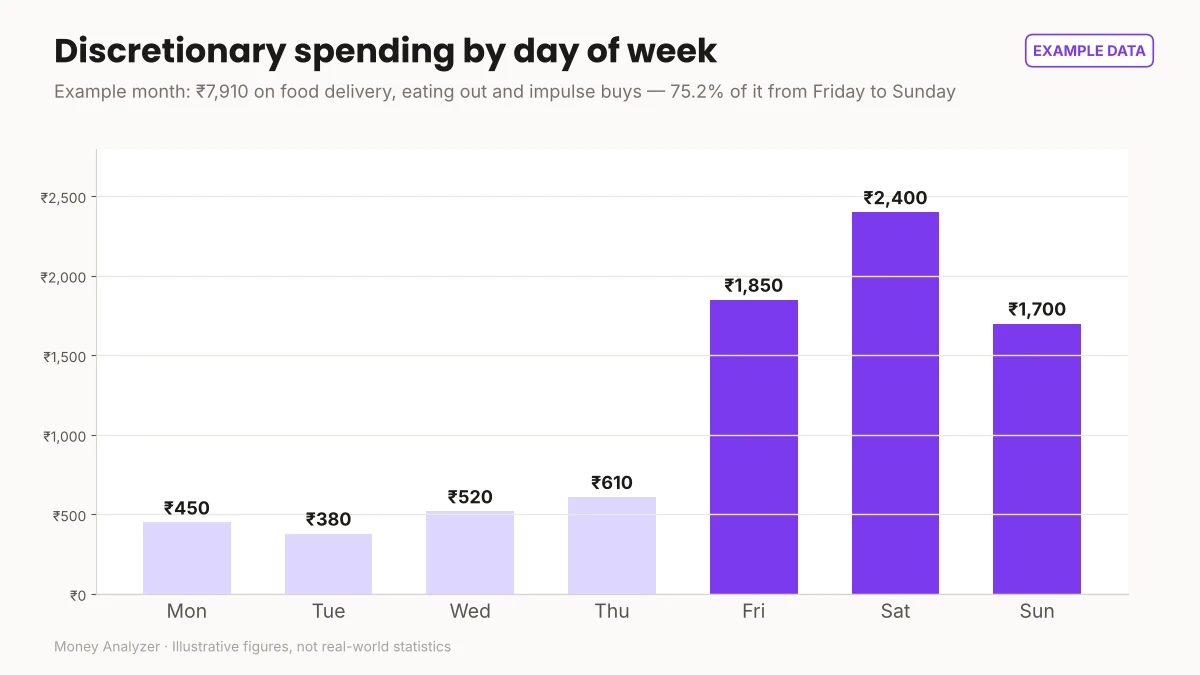
Arjun's monthly total looked reasonable, so he assumed his spending was under control. When he grouped one month's discretionary spending (delivery, eating out and impulse buys) by day of the week, the pattern was obvious:
| Day | Discretionary spend (month) |
|---|---|
| Monday | ₹450 |
| Tuesday | ₹380 |
| Wednesday | ₹520 |
| Thursday | ₹610 |
| Friday | ₹1,850 |
| Saturday | ₹2,400 |
| Sunday | ₹1,700 |
| Total | ₹7,910 |
The calculations
textFriday–Sunday   = ₹1,850 + ₹2,400 + ₹1,700 = ₹5,950
Monday–Thursday = ₹450 + ₹380 + ₹520 + ₹610 = ₹1,960
Weekend share   = ₹5,950 ÷ ₹7,910 × 100 = 75.2%
What Arjun learns: three days of the week account for three-quarters of his discretionary spending. His weekdays are already disciplined, so there's nothing to fix there. The question is only about weekends: what triggers it (social plans, and not cooking on Saturdays) and which of those spends he actually values.
His change: plan one home-cooked Saturday meal and keep the Friday dinner out, which he genuinely enjoys. Next month, he'll check whether the Saturday figure moved.
How to change one habit at a time
- Pick the habit with the biggest monthly total among your discretionary categories.
- Decide what part you value. Keep that part deliberately.
- Change the cue or add friction for the rest (remove a saved card from an app, turn off sale notifications, plan meals for your highest-spend day). If the habit is a recurring charge, run the audit in How to Find Unnecessary Expenses.
- Set a specific limit for next month, e.g. "four delivery orders a week" rather than "spend less on food".
- Review after one month. Month-over-Month Spending Analysis explains how to read the change fairly.
Common mistakes
- Judging habits by monthly totals alone. Frequency and timing often reveal more.
- Analyzing too short a period. One week can be unusual; use at least a full month.
- Treating every habit as bad. Some habits are worth their cost to you. The point is to choose, not to cut everything.
- Changing too many habits at once. It's hard to tell what worked.
How Money Analyzer can help
Money Analyzer lets you track expenses and analyze your spending with charts, which makes category totals and patterns easier to see than in a raw transaction list. Use it to log a full month of spending, then apply the four lenses above to your discretionary categories.
Review the tool's privacy policy before entering financial information, and never enter passwords, PINs or card numbers.
Frequently asked questions
How do I analyze my spending habits?
Take one full month of categorized transactions and look at your discretionary categories by frequency (how often), timing (when), size (average transaction) and trigger (what came before). The most frequent or largest habits are where small changes have the biggest effect.
What is a spending pattern?
A spending pattern is a repeated tendency in how, when or where you spend, such as weekend spikes, spending more right after payday, or frequent small delivery orders.
How long should I track spending before analyzing habits?
At least one full month. Two or three months makes patterns more reliable, because any single month can include unusual events.
Are small daily purchases really a problem?
Not necessarily. They're worth looking at because they repeat. Multiply the average amount by how often it happens in a month to see the real total, then decide whether it's worth it to you.
What's the difference between spending analysis and budgeting?
Spending analysis looks backward at what actually happened. Budgeting plans forward. Good budgets are built on spending analysis.
Conclusion
Spending habits are easier to change once you can see them. Look at frequency, timing, size and trigger, find the one habit with the biggest monthly cost, decide what part of it you value, and change the rest. Then review a month later.
Try it: track a month of spending in Money Analyzer and look for your own pattern.
This article is general educational information, not personalised financial advice.
Sources: Consumer Financial Protection Bureau, Your Money, Your Goals toolkit · Reserve Bank of India, Financial literacy material
Related Posts
How to Analyze Bank Statement Spending Safely
Learn to read bank and UPI statements, categorize transactions, and analyze your spending, while keeping OTPs, PINs and account details private.
Read More
Budget vs Actual Spending: How to Analyze the Gap
Compare your budget with actual spending, calculate variance in ₹ and %, and decide what to change. Includes a worked example with every formula shown.
Read More
Expense Categories: How to Categorize Your Spending
A practical list of personal expense categories, grouped into fixed, variable, discretionary and savings, plus rules for categorizing tricky transactions.
Read More