Budget vs Actual Spending: How to Analyze the Gap
A budget is a plan. Your bank statement is what actually happened. The gap between the two is the most useful number in personal budgeting, and most people never calculate it.
Budget vs actual analysis (also called variance analysis) compares each budget category with real spending, shows where you went over or under, and helps you decide whether to change your spending or change your budget. This guide gives you the two formulas, a step-by-step method, and a fully worked example.
What is budget vs actual analysis?
For each category, you put three numbers side by side:
- What you planned to spend (budget)
- What you actually spent
- The difference (variance)
A positive variance means you spent more than planned. A negative variance means you spent less.
The two variance formulas
textVariance (₹) = Actual spending − Budget
Variance (%) = (Actual spending − Budget) ÷ Budget × 100
You need both. The rupee figure shows how much money is involved. The percentage shows how far off the plan was, relative to the size of the budget. A ₹1,000 overspend is minor on a ₹20,000 budget (5%) but large on a ₹2,000 budget (50%).
How to compare your budget with actual spending
- Use the same categories for budget and actual. If your budget has "Food" but your spending is split into "Groceries" and "Delivery", combine them first.
- Use a complete month. Partial months understate monthly bills.
- Calculate variance in ₹ and % for each category.
- Calculate the total variance across all categories.
- Sort by ₹ variance to see which overspends matter most in money terms.
- Decide on each large variance: was it a one-off, a habit, or an unrealistic budget?
Example: a budget vs actual analysis
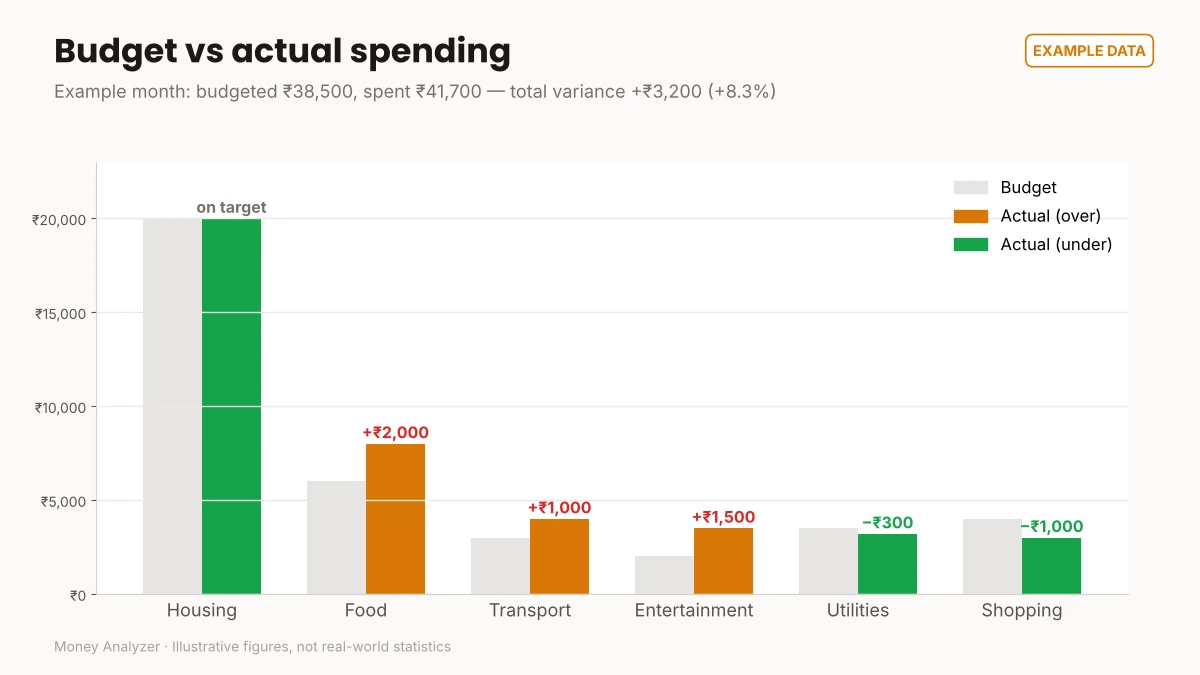
Example. The numbers below are illustrative, not real-world statistics.
| Category | Budget | Actual | Variance (₹) | Variance (%) |
|---|---|---|---|---|
| Housing | ₹20,000 | ₹20,000 | ₹0 | 0.0% |
| Food | ₹6,000 | ₹8,000 | +₹2,000 | +33.3% |
| Transport | ₹3,000 | ₹4,000 | +₹1,000 | +33.3% |
| Entertainment | ₹2,000 | ₹3,500 | +₹1,500 | +75.0% |
| Utilities | ₹3,500 | ₹3,200 | −₹300 | −8.6% |
| Shopping | ₹4,000 | ₹3,000 | −₹1,000 | −25.0% |
| Total | ₹38,500 | ₹41,700 | +₹3,200 | +8.3% |
Checking the maths
textTotal budget  = 20,000 + 6,000 + 3,000 + 2,000 + 3,500 + 4,000 = ₹38,500
Total actual  = 20,000 + 8,000 + 4,000 + 3,500 + 3,200 + 3,000 = ₹41,700
Total variance = ₹41,700 − ₹38,500 = +₹3,200
Variance %     = ₹3,200 ÷ ₹38,500 × 100 = +8.3%

Food          = (8,000 − 6,000) ÷ 6,000 × 100 = +33.3%
Entertainment = (3,500 − 2,000) ÷ 2,000 × 100 = +75.0%
Shopping      = (3,000 − 4,000) ÷ 4,000 × 100 = −25.0%
Reading the variances: signal vs noise
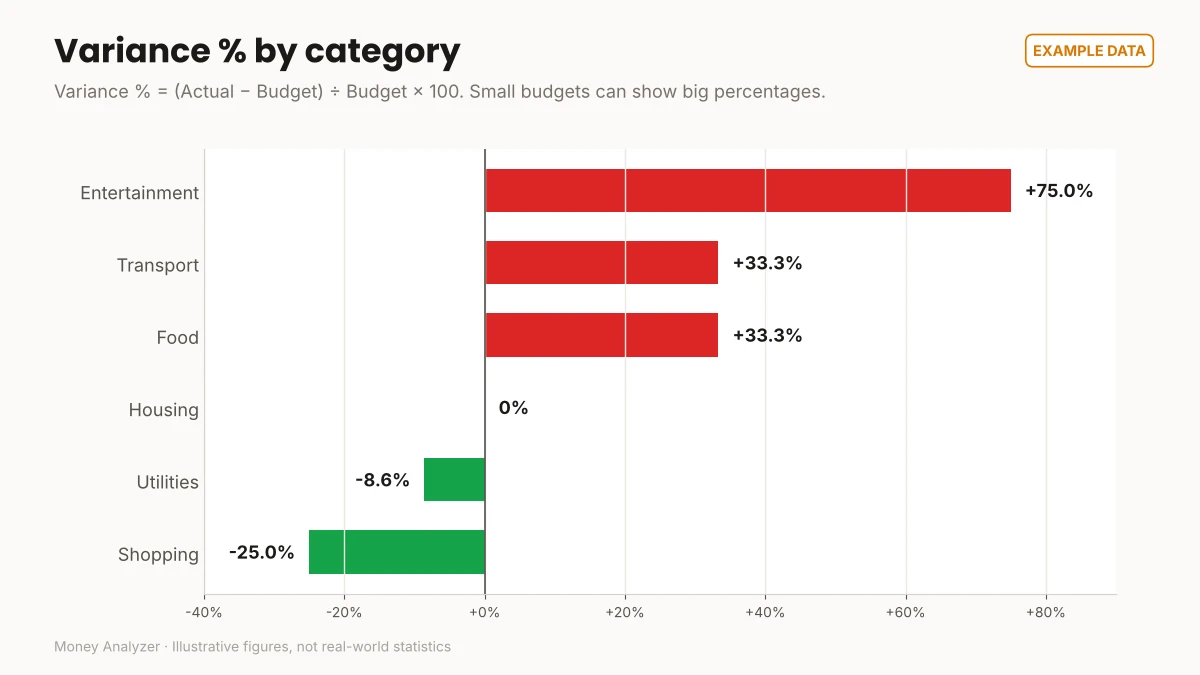
- Entertainment has the highest % variance (+75%) but a smaller ₹ overspend (₹1,500) than food. High percentages on small budgets can look dramatic.
- Food has the largest ₹ overspend (+₹2,000). In money terms, this is the most important line.
- Under-budget categories offset part of the overspend. Shopping (−₹1,000) and utilities (−₹300) together saved ₹1,300, which is why the total overspend is ₹3,200 rather than ₹4,500.
- Housing is exactly on budget, as you'd expect for a fixed cost.
A practical rule: look first at the largest ₹ variances, then use % to judge whether the budget itself was realistic.
What to do with over- and under-budget categories
For each significant variance, ask one question: Was this a one-off, a habit, or an unrealistic budget?
| Cause | Example | Response |
|---|---|---|
| One-off | Friend's farewell dinner | Leave the budget; plan a "one-off" buffer |
| Habit | Delivery orders 5× a week | Change the behaviour (see How to Find Unnecessary Expenses) |
| Unrealistic budget | Transport budget set before a fuel price rise | Raise the budget and reduce another category |
Under-budget categories deserve a look too. Consistently underspending by a lot means the budget is too high, and that money could be assigned to savings or to a category that keeps running over.
Common mistakes
- Only looking at the total. A small total variance can hide a large overspend offset by an underspend.
- Ignoring % variance on small categories. They're often where habits start.
- Using different categories for budget and actual.
- Adjusting the budget every time you overspend. Then the budget stops being a plan. Change it only when the overspend is structural.
- Forgetting irregular bills (insurance, annual subscriptions, school fees). Set aside a monthly amount for them.
How Money Analyzer can help
Money Analyzer is built for tracking expenses, managing budgets and analyzing spending with charts. Use it to compare your budget with actual spending each month instead of maintaining a spreadsheet by hand.
Review the privacy policy before entering financial information. Budget analysis never requires passwords, PINs or account numbers.
Frequently asked questions
What is budget vs actual?
It's a comparison of what you planned to spend in each category with what you actually spent, showing the difference (variance) in rupees and as a percentage.
How do I calculate budget variance?
Variance (₹) = Actual − Budget. Variance (%) = (Actual − Budget) ÷ Budget × 100. A positive result means overspending; negative means underspending.
What's an acceptable budget variance?
There's no universal threshold. Many people treat small variances on large fixed categories as normal and focus on large ₹ variances and categories that run over every month. Decide on a threshold that suits your situation.
Should I change my budget if I keep overspending?
If a category runs over every month for a structural reason (prices rose, family size changed), update the budget and reduce something else. If the overspend comes from a habit, work on the habit first.
How often should I do a budget vs actual review?
Monthly, with an optional quick check mid-month for your most variable categories.
What's the difference between a budget analyzer and a budget planner?
A planner helps you set the budget. Budget analysis compares that plan with real spending after the fact. You need both.
Conclusion
Budget vs actual analysis turns a budget from a wish into a feedback loop. Calculate the variance in ₹ and %, focus on the largest ₹ overspends, decide whether each one is a one-off, a habit or a bad estimate, and adjust accordingly.
For tracking these numbers over time, see 7 Personal Finance Metrics to Track.
Start now: compare your budget with actual spending in Money Analyzer.
This article is general educational information, not personalised financial advice.
Sources: Vikaspedia (Government of India), Household budgeting and cash flow management · Consumer Financial Protection Bureau, Your Money, Your Goals toolkit
Related Posts
How to Analyze Bank Statement Spending Safely
Learn to read bank and UPI statements, categorize transactions, and analyze your spending, while keeping OTPs, PINs and account details private.
Read More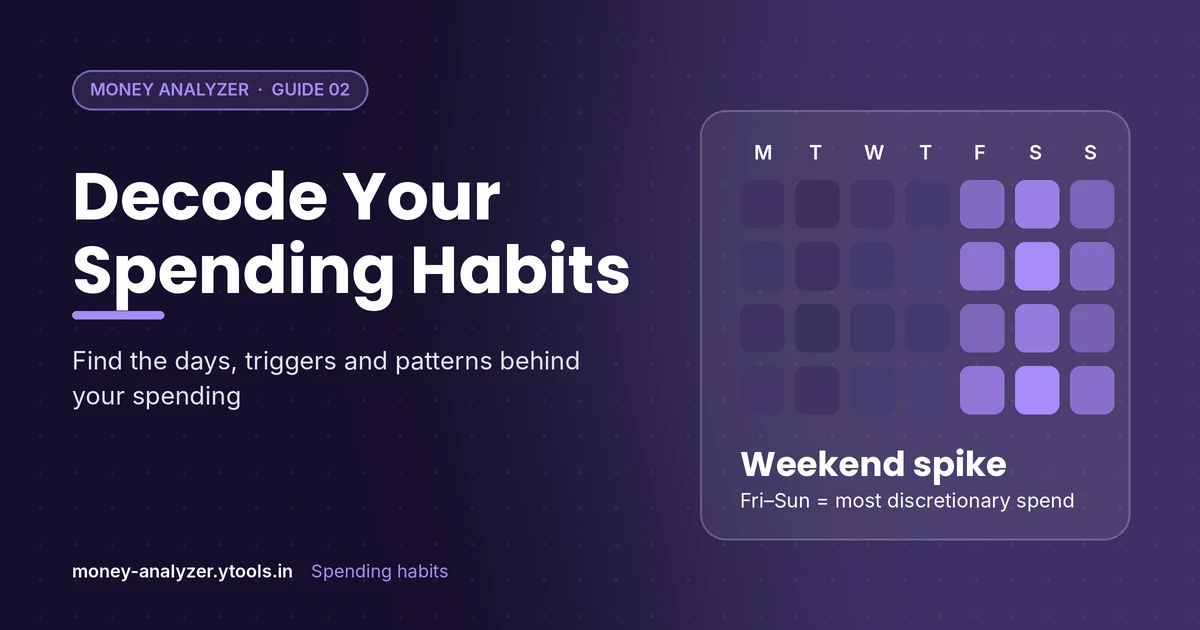
How to Analyze Your Spending Habits: Find Your Patterns
Learn how to analyze your spending habits by looking at frequency, timing and triggers. Includes a worked ₹ example and a simple habit-review method.
Read More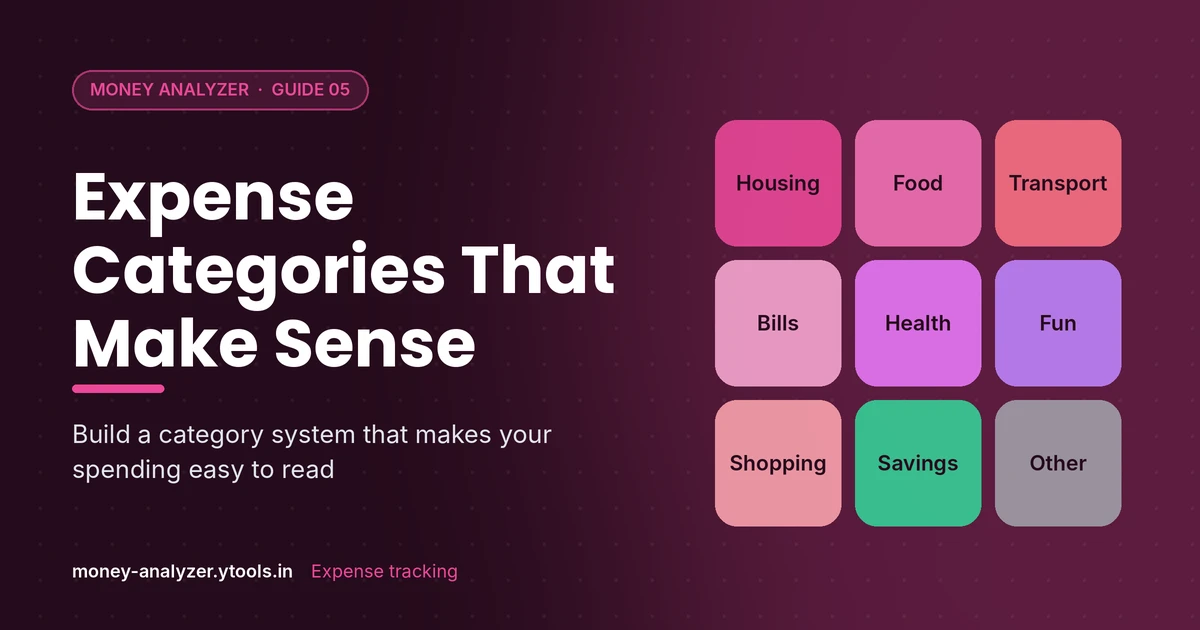
Expense Categories: How to Categorize Your Spending
A practical list of personal expense categories, grouped into fixed, variable, discretionary and savings, plus rules for categorizing tricky transactions.
Read More