7 Personal Finance Metrics to Track (With Formulas)
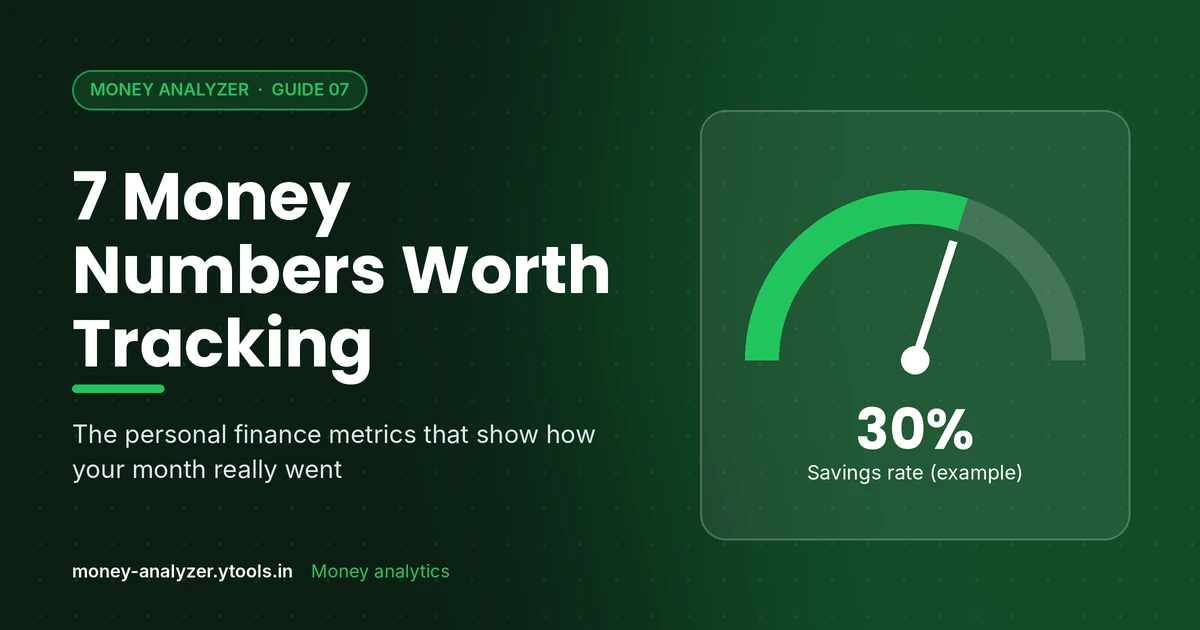
"Am I doing okay with money?" is hard to answer with a feeling. It's much easier with a handful of numbers that you calculate the same way every month.
These seven personal finance metrics cover saving, spending structure, debt, plan vs reality, and resilience. Each comes with a formula, a worked example, and a note on how to read it.
Why a small set of metrics?
Big dashboards get ignored. Seven numbers, calculated consistently, are enough to show direction. The trend in each metric over several months tells you more than any single month's value.
The example household
Example. The numbers below are illustrative, not real-world statistics.
| Item | Monthly amount |
|---|---|
| Take-home income | ₹75,000 |
| Fixed costs (rent ₹12,000 + home-loan EMI ₹15,000 + insurance/internet ₹3,000) | ₹30,000 |
| Variable essentials (groceries, utilities, transport) | ₹10,500 |
| Discretionary spending | ₹12,000 |
| Total expenses | ₹52,500 |
| Savings (income − expenses) | ₹22,500 |
| Monthly budget (planned spending) | ₹50,000 |
| Emergency fund balance | ₹1,62,000 |
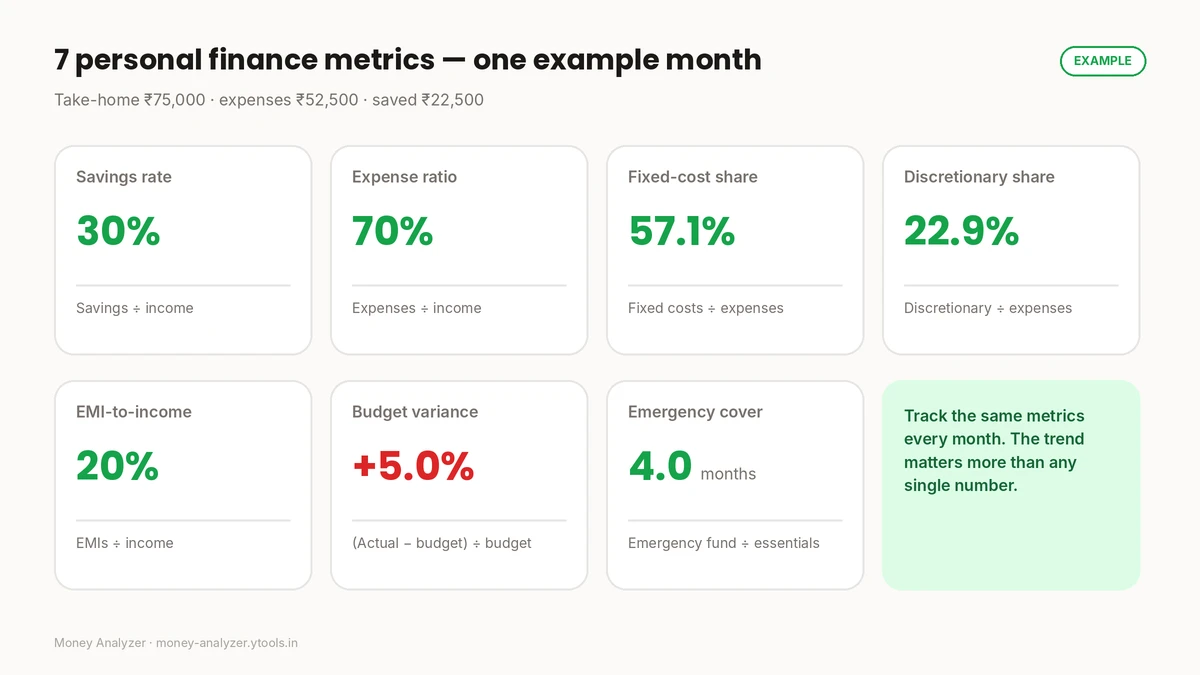
1. Savings rate
What it shows: the share of your income you keep.
textSavings rate = (Income − Expenses) ÷ Income × 100
             = (₹75,000 − ₹52,500) ÷ ₹75,000 × 100 = 30%
How to read it: there's no universal "right" rate; it depends on income, dependants and goals. Watch the direction. A steadily rising savings rate usually means spending is growing slower than income.
2. Expense ratio
What it shows: the share of income that goes out as spending. It's the mirror image of savings rate.
textExpense ratio = Expenses ÷ Income × 100 = ₹52,500 ÷ ₹75,000 × 100 = 70%
Savings rate + expense ratio = 100% (30% + 70%), as long as savings is defined as income minus expenses.
3. Fixed-cost share
What it shows: how much of your spending is locked in.
textFixed-cost share = Fixed costs ÷ Total expenses × 100 = ₹30,000 ÷ ₹52,500 × 100 = 57.1%
How to read it: a high fixed-cost share means less flexibility if income drops, because fixed costs are hard to cut quickly. It's most useful when making big commitments (a new lease, a new loan).
4. Discretionary share
What it shows: how much spending is optional.
textDiscretionary share = Discretionary ÷ Total expenses × 100 = ₹12,000 ÷ ₹52,500 × 100 = 22.9%
How to read it: this is where short-term changes happen. If you need to save more next month, this is usually the first place to look. See How to Find Unnecessary Expenses.
5. EMI-to-income ratio
What it shows: how much of your income goes to loan repayments.
textEMI-to-income = Total monthly EMIs ÷ Income × 100 = ₹15,000 ÷ ₹75,000 × 100 = 20%
How to read it: this example uses take-home pay for simplicity. Lenders calculate their own versions (often called debt-to-income or FOIR) using their own definitions of income, so your figure won't necessarily match a lender's. Track yours consistently; a rising ratio means more of each month is pre-committed.
6. Budget variance
What it shows: how far actual spending was from plan.
textBudget variance (%) = (Actual − Budget) ÷ Budget × 100
                    = (₹52,500 − ₹50,000) ÷ ₹50,000 × 100 = +5.0%
How to read it: positive means overspending. The category-level detail matters more than the total; Budget vs Actual Spending shows how to break it down.
7. Emergency fund coverage
What it shows: how many months your essential costs could be covered from savings.
textEssential monthly expenses = Fixed + Variable essentials = ₹30,000 + ₹10,500 = ₹40,500
Emergency cover (months)   = Emergency fund ÷ Essential monthly expenses
                           = ₹1,62,000 ÷ ₹40,500 = 4.0 months
How to read it: use essential expenses, not total expenses, because in an emergency you'd likely pause discretionary spending. How many months is enough depends on job stability, dependants and other safety nets; consumer-education resources such as RBI's financial literacy material and the CFPB toolkit cover emergency savings in more detail.
Summary: the seven metrics at a glance
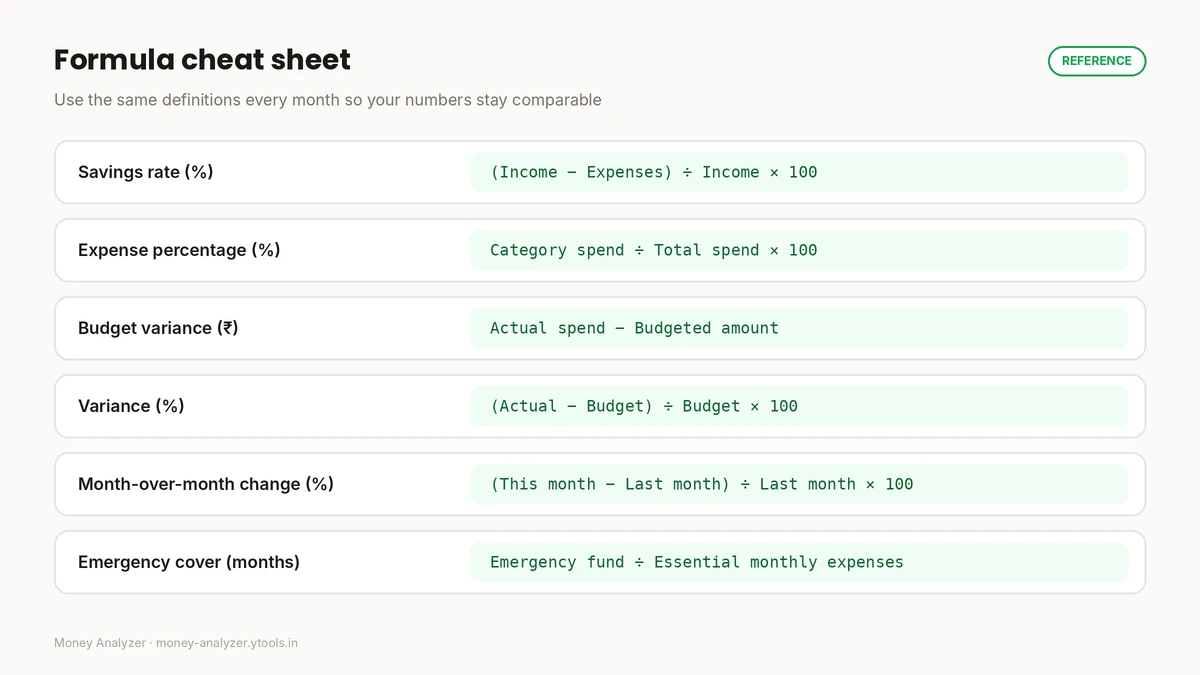
| # | Metric | Formula | Example |
|---|---|---|---|
| 1 | Savings rate | (Income − Expenses) ÷ Income × 100 | 30% |
| 2 | Expense ratio | Expenses ÷ Income × 100 | 70% |
| 3 | Fixed-cost share | Fixed ÷ Expenses × 100 | 57.1% |
| 4 | Discretionary share | Discretionary ÷ Expenses × 100 | 22.9% |
| 5 | EMI-to-income | EMIs ÷ Income × 100 | 20% |
| 6 | Budget variance | (Actual − Budget) ÷ Budget × 100 | +5.0% |
| 7 | Emergency cover | Emergency fund ÷ Essential expenses | 4.0 months |
Tracking them over time
Calculate all seven on the same day each month (for example, the first weekend after month end) and keep them in one place. After three months, look at the direction of each. Month-over-Month Spending Analysis explains how to read changes without overreacting to one unusual month.
The limits of these metrics
- They describe your cash flow; they don't evaluate investments, insurance adequacy or tax.
- Definitions vary. Pick one definition per metric and keep it.
- A single month can mislead. Use trends.
- They're general information, not personalised advice. For decisions about debt, investments or insurance, consider a qualified, registered professional.
How Money Analyzer can help
Most of these metrics need accurate category totals. Money Analyzer tracks expenses by category, manages budgets and charts your spending, which gives you the inputs for metrics 1–6. For the concept behind all this, see What Is Money Analytics?. Review the privacy policy before entering financial information.
Frequently asked questions
What personal finance metrics should I track?
A practical core set: savings rate, expense ratio, fixed-cost share, discretionary share, EMI-to-income, budget variance and emergency fund coverage.
How do I calculate my savings rate?
Savings rate = (Income − Expenses) ÷ Income × 100. With ₹75,000 income and ₹52,500 expenses, that's 30%.
Should I use gross or take-home income?
Either works if you're consistent. Take-home is simpler for monthly cash-flow tracking. Lenders often use their own definitions, so their ratios may differ from yours.
What's the difference between fixed-cost share and expense ratio?
Expense ratio compares spending to income. Fixed-cost share compares fixed costs to total spending; it shows how flexible your spending is.
How do I calculate emergency fund coverage?
Divide your emergency fund by your essential monthly expenses (fixed costs plus variable essentials). ₹1,62,000 ÷ ₹40,500 = 4.0 months.
How often should I calculate these metrics?
Monthly. The trend over three or more months is more meaningful than any one month.
Conclusion
Seven numbers, calculated the same way every month, tell you more about your finances than a vague sense of "doing fine". Start with savings rate and budget variance, add the rest as your tracking gets more complete, and watch the trends.
Get the inputs right: track your spending by category in Money Analyzer.
This article is general educational information, not personalised financial advice.
Sources: Reserve Bank of India, Financial literacy material · Consumer Financial Protection Bureau, Your Money, Your Goals toolkit
Related Posts
How to Analyze Bank Statement Spending Safely
Learn to read bank and UPI statements, categorize transactions, and analyze your spending, while keeping OTPs, PINs and account details private.
Read More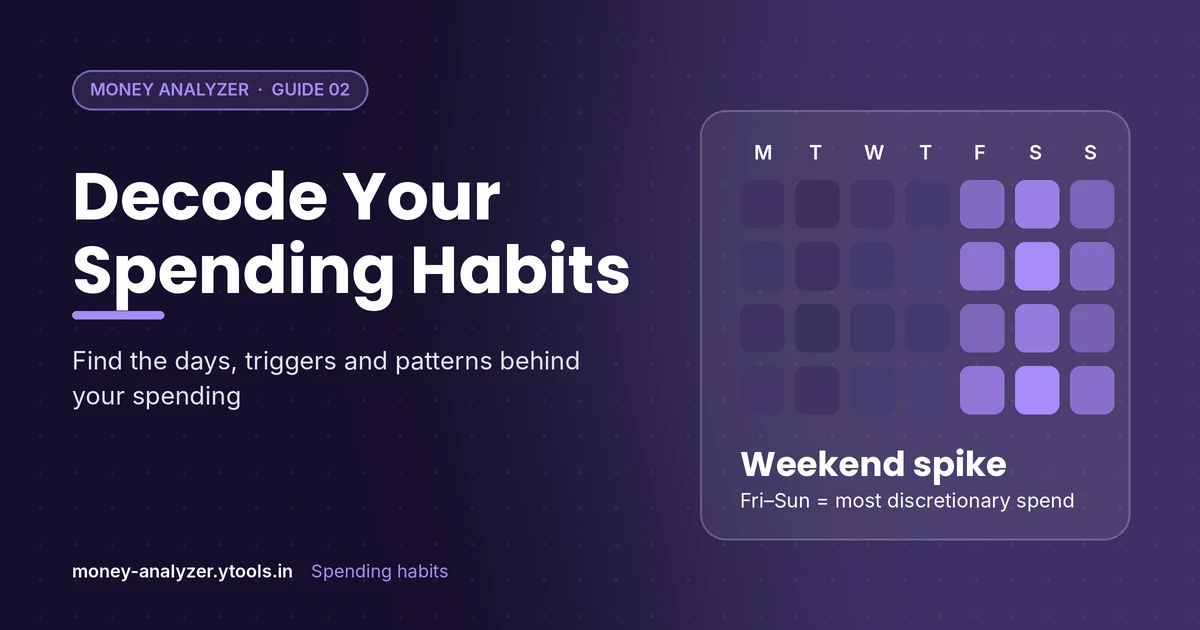
How to Analyze Your Spending Habits: Find Your Patterns
Learn how to analyze your spending habits by looking at frequency, timing and triggers. Includes a worked ₹ example and a simple habit-review method.
Read More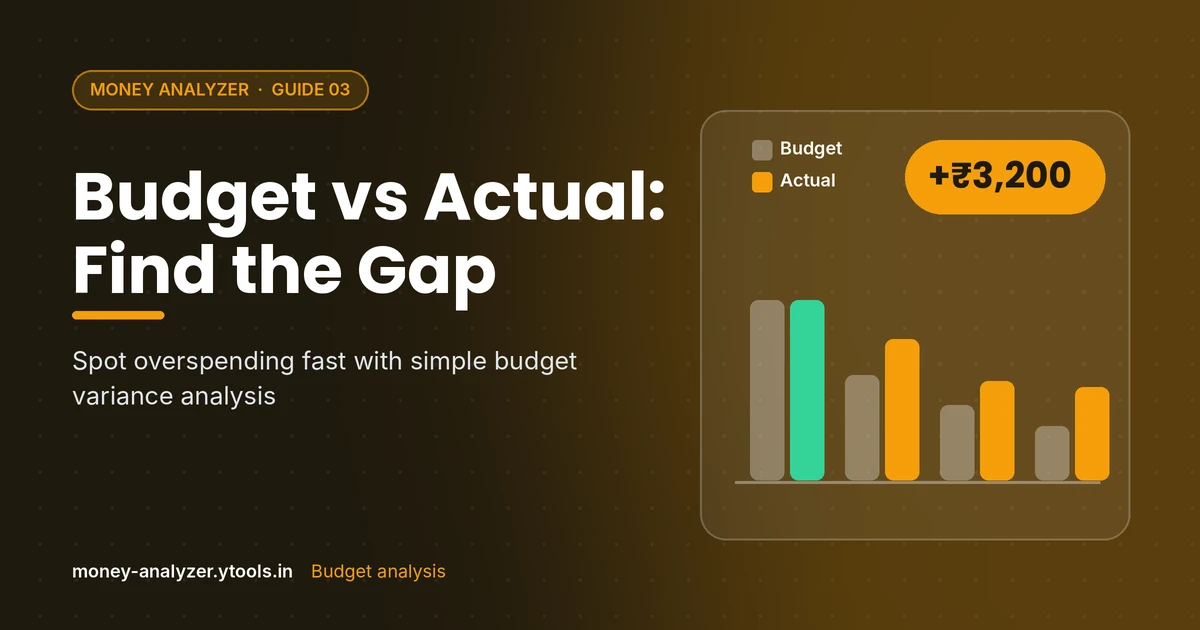
Budget vs Actual Spending: How to Analyze the Gap
Compare your budget with actual spending, calculate variance in ₹ and %, and decide what to change. Includes a worked example with every formula shown.
Read More