How to Analyze Your Monthly Expenses in 6 Steps
Most people know roughly what they earn. Far fewer can say where last month's money actually went. Not because they're careless, but because spending is scattered across UPI apps, cards, cash and auto-debits, and nobody adds it up.
Analyzing your monthly expenses fixes that. It takes an hour the first time and about twenty minutes after that. This guide walks through a repeatable six-step method, then works through a full example so you can see the numbers.
What is expense analysis?
Expense analysis means taking a period's spending, grouping it into categories, and asking what the totals tell you. Tracking records each transaction. Analysis turns that record into answers: Which category is largest? Is anything growing? What didn't I expect?
If you only track, you have a list. If you analyze, you have a decision. (There's a deeper comparison in Expense Tracking vs Expense Analysis.)
Why analyze your expenses every month?
- Memory is unreliable. Small, frequent payments are easy to forget; a month's view brings them back.
- A month matches how bills work. Rent, salary, EMIs and most subscriptions run monthly, so monthly totals are comparable.
- It makes budgeting realistic. A budget built on actual spending is far easier to stick to than one built on guesses. Consumer-education material such as the CFPB's Your Money, Your Goals toolkit and India's Vikaspedia household-budgeting guide both start from the same point: know what you really spend first.
How to analyze your expenses, step by step
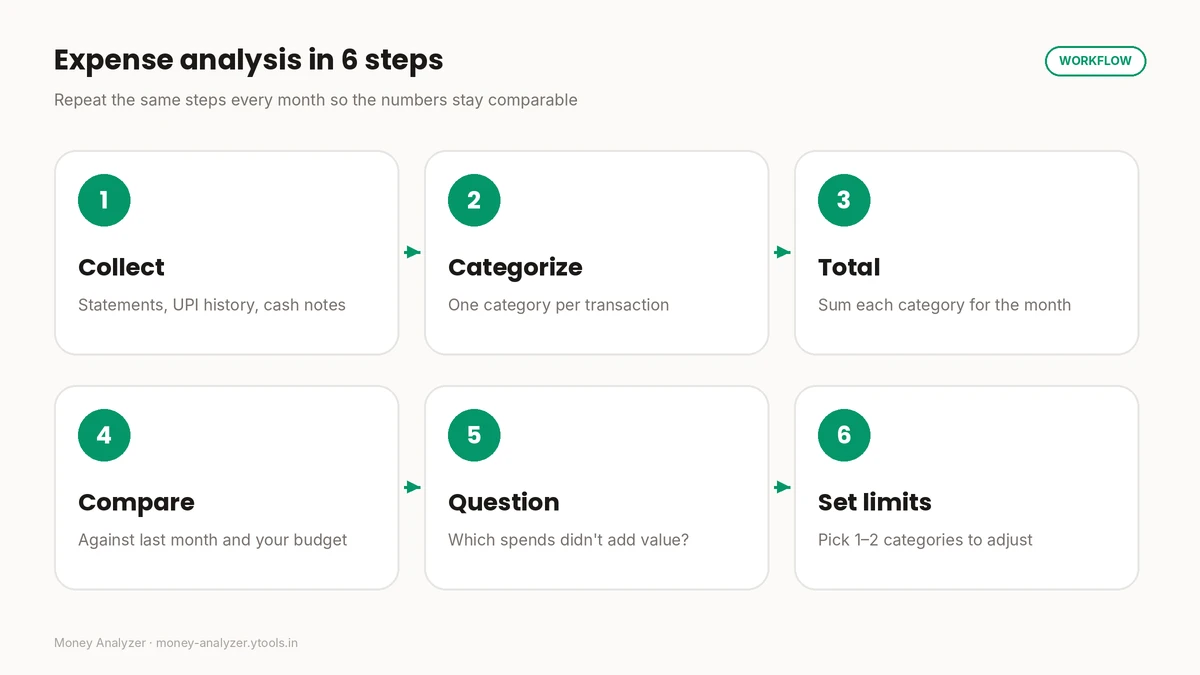
Step 1 — Collect your expense data
Gather one full calendar month from every place money leaves you:
- Bank account statements
- UPI app history
- Credit card statements
- Wallet balances
- Cash (a rough note is fine; "₹2,000 cash, mostly vegetables and auto fares" is better than nothing)
Use a complete month. A half-month will understate anything paid once a month.
Step 2 — Categorize your spending
Give every transaction exactly one category. Eight to twelve categories is enough for most households: housing, food and groceries, transport, utilities, shopping, entertainment, subscriptions, health, and "other". If "other" ends up larger than about 10% of your spending, it's hiding something and needs splitting.
Keep categories the same every month, or month-to-month comparison stops working. Expense Categories: How to Categorize Your Spending has a ready-made system.
Step 3 — Calculate category totals and percentages
Add up each category, then work out what share of total spending it represents:
textExpense percentage = Category expense ÷ Total expenses × 100
Percentages matter because they let you compare months with different totals, and they make your biggest categories obvious.
Step 4 — Compare against last month and your budget
One month in isolation tells you little. Compare each category with the previous month, and with your budget if you have one:
textMonth-over-month change (%) = (This month − Last month) ÷ Last month × 100
Look for the two or three categories with the biggest change, not every small wobble. For the budget side, Budget vs Actual Spending explains variance analysis in detail.
Step 5 — Question the spending
Go through your largest and fastest-growing categories and ask, for each one: Did this add real value to my month? Typical findings include overlapping subscriptions, frequent delivery fees, and memberships you rarely used. How to Find Unnecessary Expenses turns this into a structured audit.
Step 6 — Set one or two spending limits
Don't try to fix everything. Pick one or two categories and set a specific monthly limit for next month, based on what you just learned. Next month's analysis will tell you whether it worked.
Example: a monthly expense analysis
Example. The numbers below are illustrative, not real-world statistics.
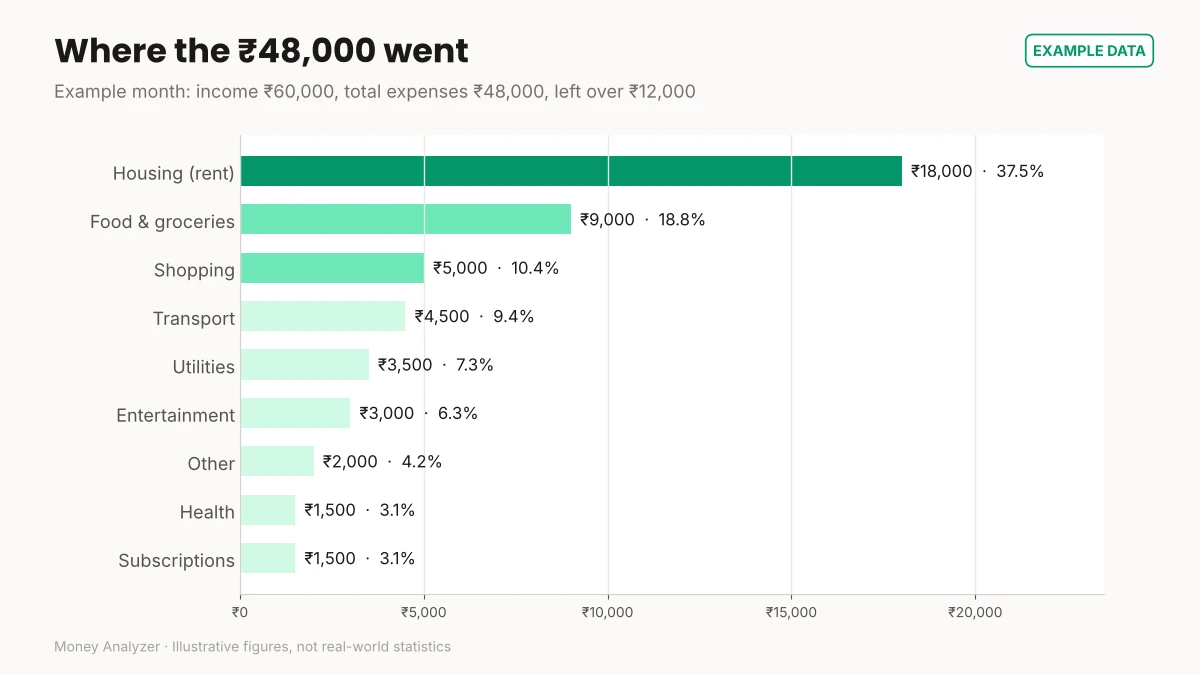
Priya earns ₹60,000 a month after tax. Here is her month, after Steps 1–3:
| Category | Amount | % of expenses |
|---|---|---|
| Housing (rent) | ₹18,000 | 37.5% |
| Food & groceries | ₹9,000 | 18.8% |
| Shopping | ₹5,000 | 10.4% |
| Transport | ₹4,500 | 9.4% |
| Utilities | ₹3,500 | 7.3% |
| Entertainment | ₹3,000 | 6.3% |
| Other | ₹2,000 | 4.2% |
| Subscriptions | ₹1,500 | 3.1% |
| Health | ₹1,500 | 3.1% |
| Total | ₹48,000 | 100% |
(Percentages are rounded to one decimal place, so they may not add to exactly 100.0%.)
The calculations
textTotal expenses   = ₹48,000
Money left over  = ₹60,000 − ₹48,000 = ₹12,000
Savings rate     = ₹12,000 ÷ ₹60,000 × 100 = 20%
Housing share    = ₹18,000 ÷ ₹48,000 × 100 = 37.5%
What Priya learns
- Rent dominates (37.5%). It's fixed in the short term, so it's not where she'll find quick changes, but it's worth remembering at lease renewal.
- Food is the biggest flexible category (₹9,000). When she splits it, groceries and delivery orders turn out to be roughly half each. Delivery is the obvious place to look.
- Shopping (₹5,000) is bigger than transport. Not necessarily a problem, but worth noticing.
- ₹12,000 is left (20%). That's a baseline to measure next month against.
Her two limits for next month: food delivery capped at ₹3,500, shopping at ₹4,000. Next month's analysis will show whether those limits were realistic.
Common expense analysis mistakes
- Analyzing a partial month. You'll miss once-a-month bills.
- Counting transfers as spending. Moving money to your own savings account or paying your own credit card bill isn't an expense. Count the card purchases, not the card payment, or you'll double-count.
- Changing categories every month. Comparisons break.
- Ignoring cash. Even an estimate is better than a gap.
- Trying to cut everything at once. One or two targeted changes are easier to sustain.
How Money Analyzer can help
Money Analyzer is a free tool for tracking expenses, managing budgets and analyzing spending with charts. Once your month's expenses are entered, you can see your category breakdown visually instead of building the chart yourself.
A note on privacy. The site states that it works offline and stores data locally on your device. Even so, review the tool's privacy policy before entering financial information, and never enter passwords, OTPs, PINs, card numbers or full account numbers into any budgeting tool. Expense analysis only needs dates, amounts and categories.
Frequently asked questions
How often should I analyze my expenses?
Monthly works for most people, because salary and most bills are monthly. A quick mid-month check of your two or three most variable categories helps you correct course before the month ends.
What's the difference between expense tracking and expense analysis?
Tracking records each transaction. Analysis groups those transactions, compares them over time or against a budget, and helps you decide what to change.
How many expense categories should I use?
Usually 8–12. Fewer and you can't see patterns; many more and the analysis becomes tedious.
Should I include EMIs and rent in my expense analysis?
Yes. They're usually your largest fixed costs, and leaving them out understates how much of your income is committed.
How do I handle credit card spending?
Categorize the individual purchases on the statement. Don't also count the bill payment from your bank account, or you'll count the same spending twice.
What is a good savings rate?
There's no single right number; it depends on income, dependants, debts and goals. The useful thing is to calculate yours consistently and watch the direction month to month. This is general information, not personalised financial advice.
Conclusion
Monthly expense analysis is six repeatable steps: collect, categorize, total, compare, question, and set one or two limits. The first month gives you a baseline. Every month after that tells you whether your changes are working.
Ready to try it? Analyze your monthly expenses with Money Analyzer and see your category breakdown.
This article is general educational information, not personalised financial advice.
Sources: Consumer Financial Protection Bureau, Your Money, Your Goals: A financial empowerment toolkit · Vikaspedia (Government of India), Household budgeting and cash flow management
Related Posts
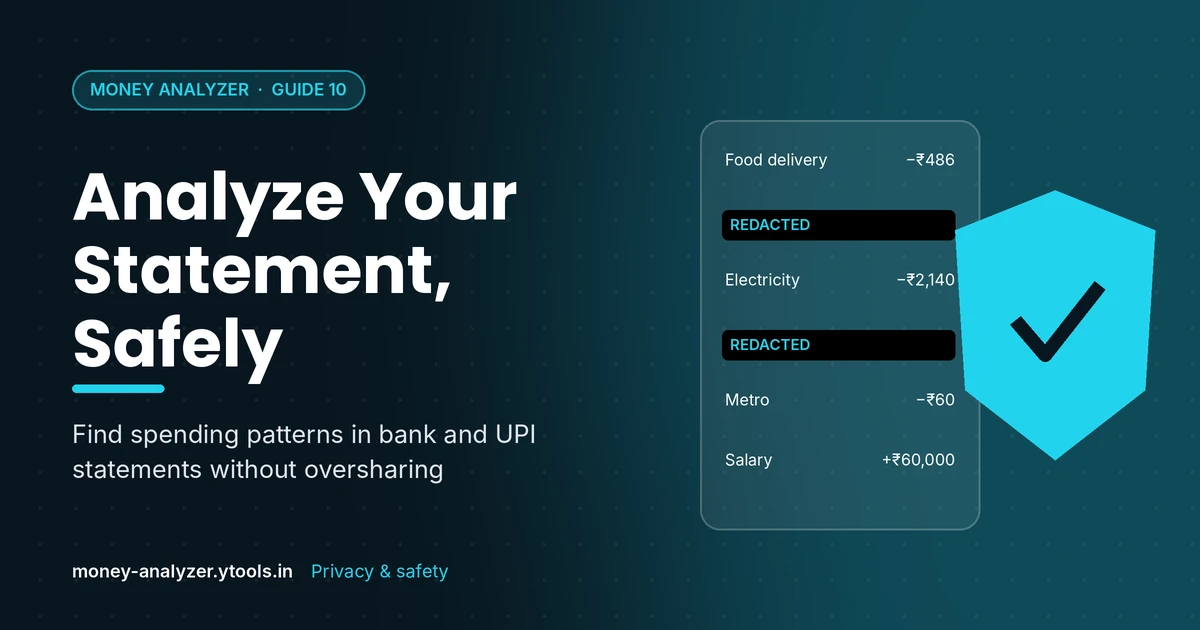
How to Analyze Bank Statement Spending Safely
Learn to read bank and UPI statements, categorize transactions, and analyze your spending, while keeping OTPs, PINs and account details private.
Read More
How to Analyze Your Spending Habits: Find Your Patterns
Learn how to analyze your spending habits by looking at frequency, timing and triggers. Includes a worked ₹ example and a simple habit-review method.
Read More
Budget vs Actual Spending: How to Analyze the Gap
Compare your budget with actual spending, calculate variance in ₹ and %, and decide what to change. Includes a worked example with every formula shown.
Read More